From the doom loop to an economy for work not wealth
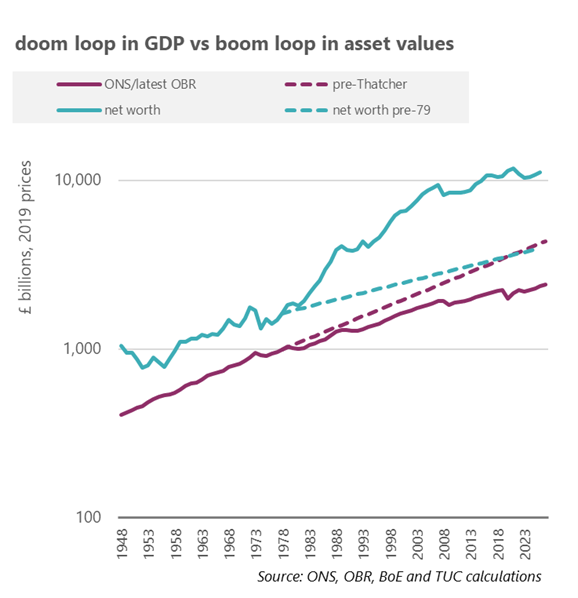
Figures 6 (over the page, the second on a log scale) traces further back to the end of the Second World War the doom loop in GDP, and a parallel ‘boom loop’ in wealth. As might be exected the obvious dislocation comes around 1979: from this point forwards GDP outcomes were set on a progressively lower trajectory and asset values on a progressively higher trajectory.30 The latter are measured using the ONS aggregate ‘net worth’ (which includes financial and non-financial assets - i.e. the housing stock), with OBR projections (to 2026)31 and Bank of England data for historic outcomes.
Had the economy followed the real GDP trajectory over the 30 years from 1948 to 1978, real GDP for 2027 (in 2019 prices) would be £4.4 trillion rather than the present forecast for £2.4tn (and £2.3tn adjusted for past forecast error).
On the other hand if net worth had followed the trajectory over the pre-1979 period, household net worth would be only £4tn rather than the present projection to a colossal £11tn.
So GDP lost £2tn but asset values gained £7tn – very crudely GDP has halved relative to pre-1979 trends but wealth has trebled (roughly evenly shared between non financial and financial wealth, see next section). So while the perpetual doom loop has greatly disadvantaged GDP it has vastly advantaged asset values. Switching perspective, ahead of 1979 a more sustained expansion in GDP was associated with a more modest expansion in asset values - real incomes expanded by 3.1 per cent a year (from £0.4tn to £1.0tn) but asset values by only 1.8 per cent a year (from £1tn to £1.6tn).
Figure 6a: Doom loop in GDP v boom loop in asset values
- 30 Margaret Thatcher was not the first to build a platform on inherited and alleged growth failures but then herself to fail to deliver: “…the root of Britain’s industrial problem was low productivity” (The Downing Street Years, p. 93).
- 31 Because of repeated changes of government leadership, the OBR had too little time to produce their full analytical dataset for Autumn Statement 2022 and the net worth figures were not updated to 2027.
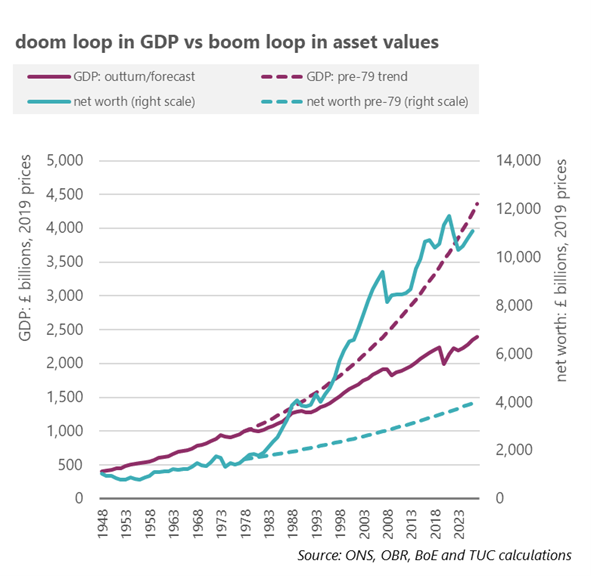
Figure 6b: Doom loop in GDP v boom loop in asset values (log scale)
Stay Updated
Want to hear about our latest news and blogs?
Sign up now to get it straight to your inbox