From the doom loop to an economy for work not wealth
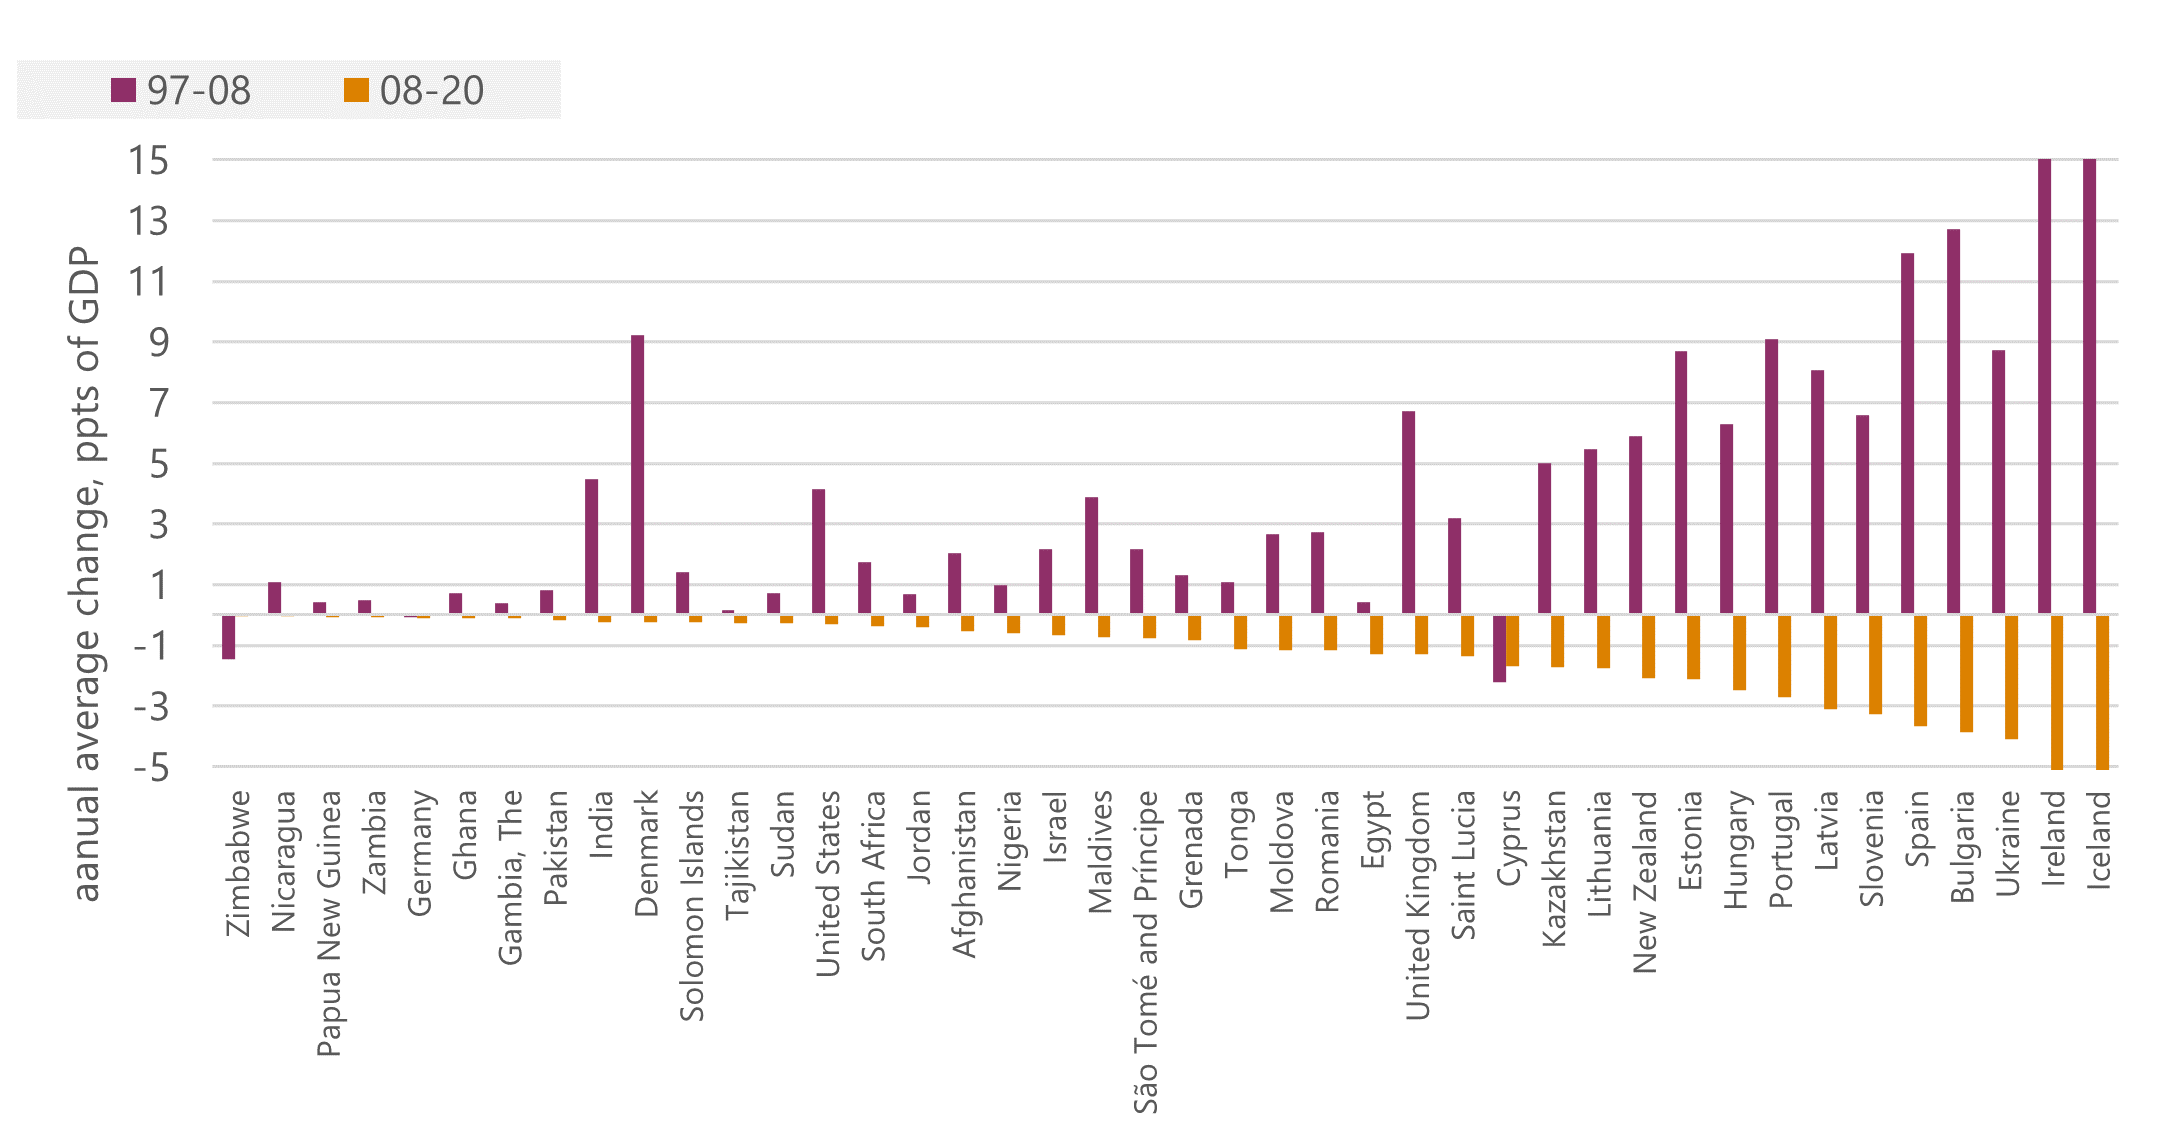
The charts over the page, based on the 2021 vintage of the IMF global debt database, show changes in indebtedness by country according to the scale of re-leveraging since the global financial crisis (GFC). Figure 6a ranks countries with the largest increases in the private debt ratio over 2008-2020, and Figure 6b ranks countries with the biggest reductions. The suggestion, is a debt inflation of a similar intensity to that ahead of the global financial crisis. In general the majority of individual counties with the biggest debt inflations are different to those in the run up to the GFC. Some countries feature on both sides of the GFC – eg Luxembourg, Norway, Sweden, Vietnam, Russia, Georgia, Belgium, Malta, Finland and Mongolia – and the level of debt remains high even for those countries on Figure 6b, given only relatively modest deleveraging.
Figure A1: Countries with the highest increases in private debt over 2008-20
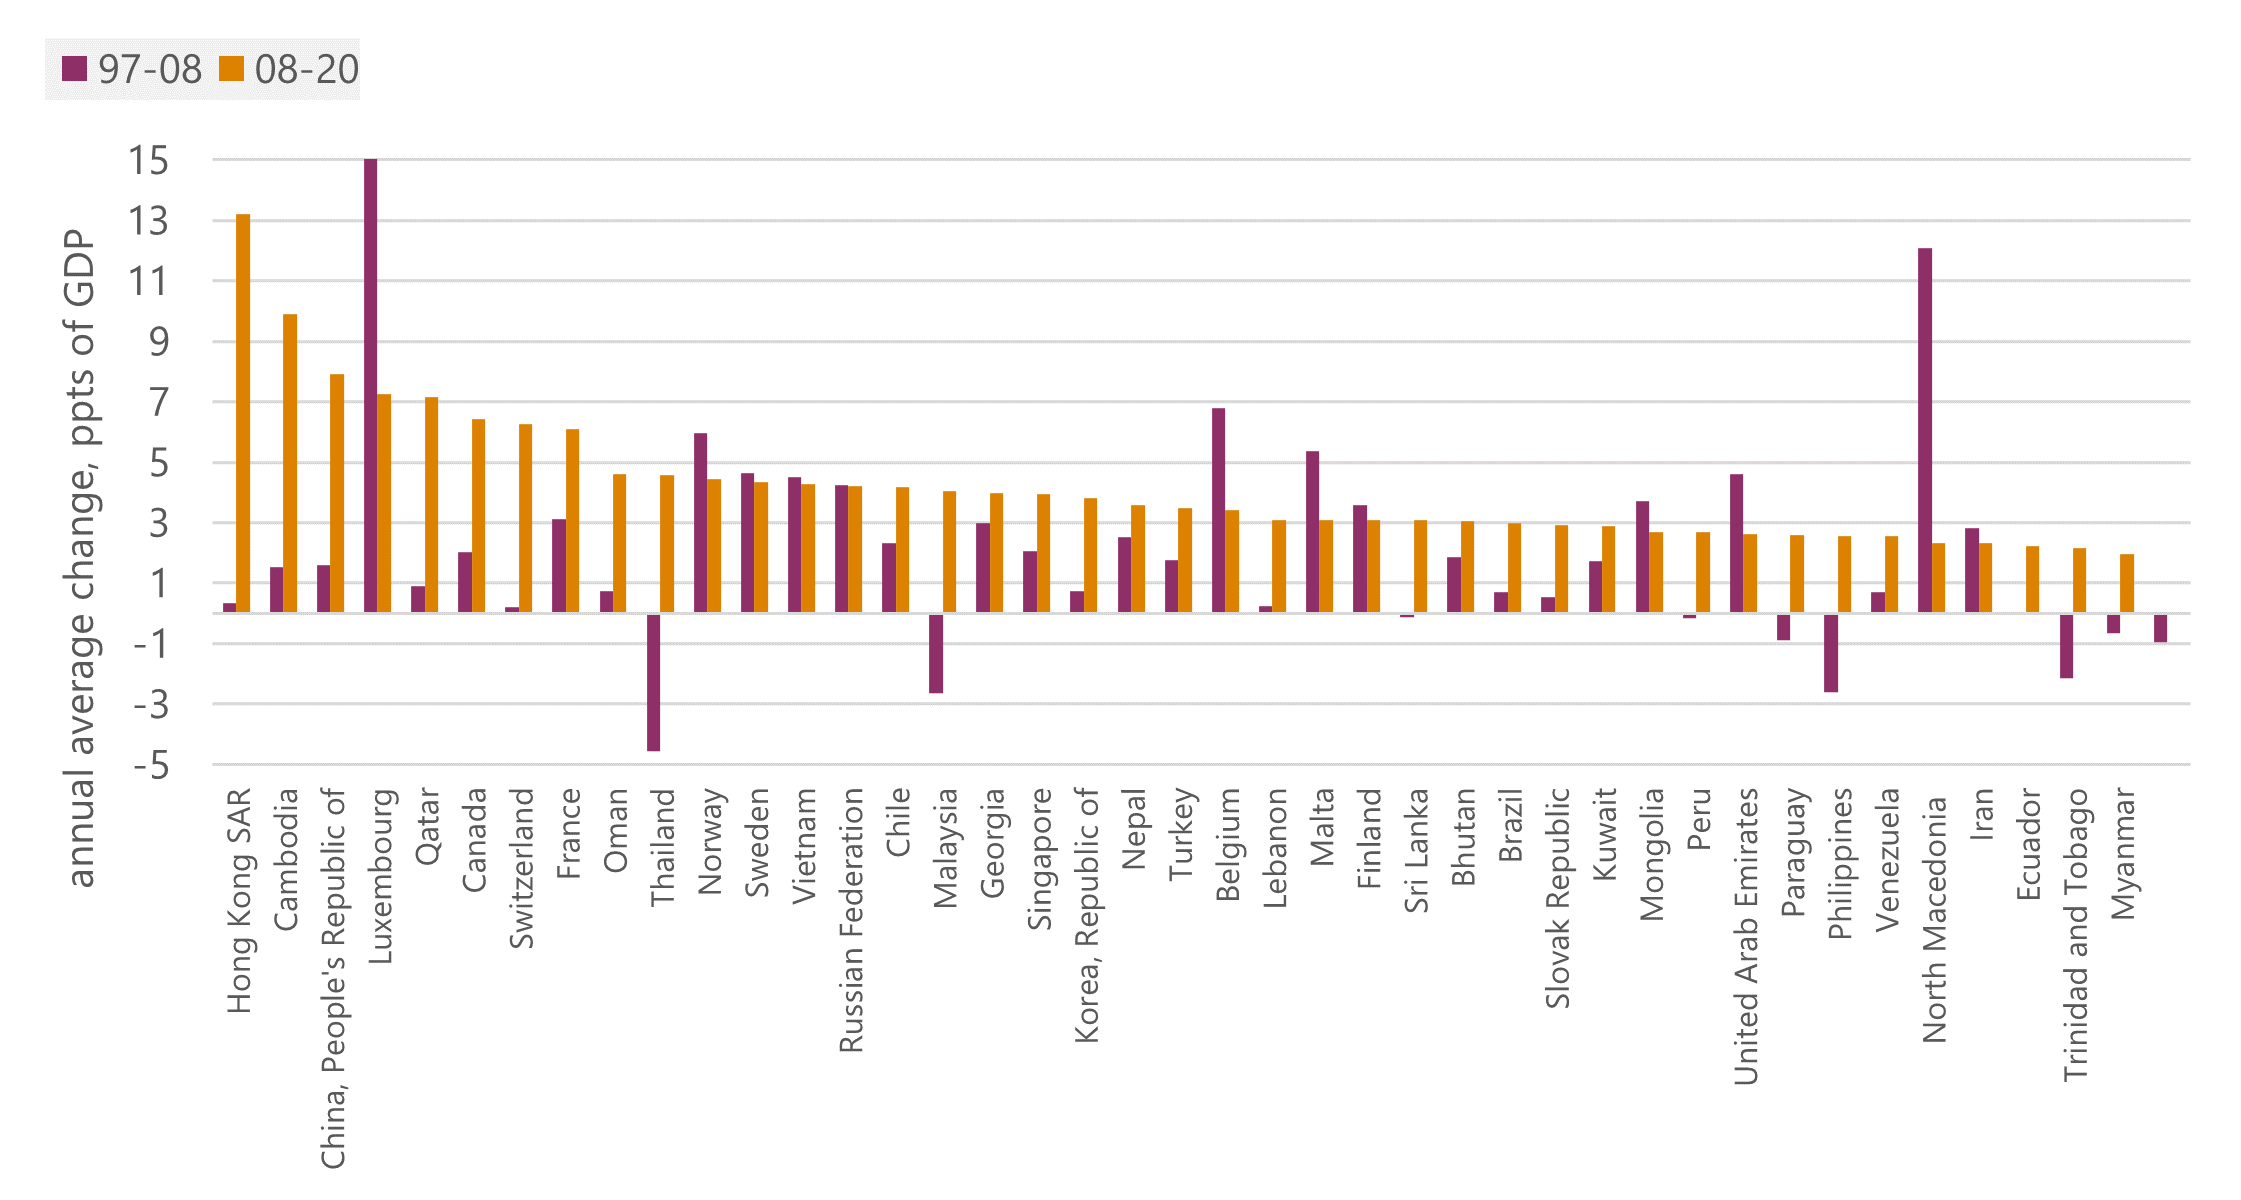
Figure A2: Countries with largest reductions in private debt over 2008-20
Stay Updated
Want to hear about our latest news and blogs?
Sign up now to get it straight to your inbox