Spring Budget 2023
The government argue public sector pay restraint is necessary to control inflation, and have warned of the risk of so called ‘wage price spirals’ - despite the comprehensive evidence that these are not a cause of inflation in the UK, or a common response to inflationary environments. But as the forecasts of the Bank and the OBR show, inflation is likely to be brought down by recession. As recessionary pressures intensify, an economic policy based on austerity 2.0 will be highly dangerous.
a. Risk of recession and unemployment
In January 2023 the Bank of England (alongside other central banks) hiked rates for the eighth time, with the rapidity of increases greatly more forceful than anticipated when the policy began. Reporting World Bank analysis, Martin Wolf shows “The current monetary tightening in the G7 is expected to be the strongest since the early 1980s”.40
In the UK the interest rate has increased from 0.1 per cent to 3.5 per cent. Huw Pill the Bank’s chief economist describes the actions as making “significant progress in the normalisation of the monetary policy stance”.41
Since the Bank of England’s November forecast and the OBR Autumn forecast, policymakers have considered the UK economy in recession. The latest Treasury evidence to the pay review bodies states “The economy contracted by 0.2% in 2022 Q3, and the OBR do not expect this recession to end until 2023 Q4, with a peak to trough fall of 2.1%”. The Bank of England in their November forecast were reckoning on something significantly worse (peak to trough fall of minus 2.9 per cent). While the monthly data have been erratic (because of the late Queen’s Jubilee and funeral, and then the world cup), and the latest outturn for November 2022 up slightly, the three-monthly growth rate is still down 0.3 per cent.
Correspondingly the labour market may be at a turning point. The unemployment rate rose to 3.7 per cent over Sep-Nov 2022, from a low point of 3.5 per cent in Jun-Aug, but the position is still better than 4.0 per cent ahead of the pandemic (Dec -Feb 2020). The employment rate is little changed over recent quarters and stands at 75.6 per cent in Sep-Nov 2022, but well down on the pre-pandemic rate of 76.6 over Dec -Feb 2020. Outside the headline figures, total hours worked have fallen for two quarters (by a total of 1.0 per cent); and vacancies have fallen for 7 consecutive months, from 1,300,000 to 1,161,000 (by 10.7 per cent). Beyond the outturn figures, the Bank of England and OBR are both forecasting a rise in unemployment, the former by one million and the latter by half a million. The widened gap between employment and unemployment since the pandemic is matched by a corresponding and widely discussed increase in inactivity. Measures to help more people get the jobs they want are essential. But with recession looming the demand for labour will fall; the Bank of England finds “some indication that the demand for labour has weakened”.44
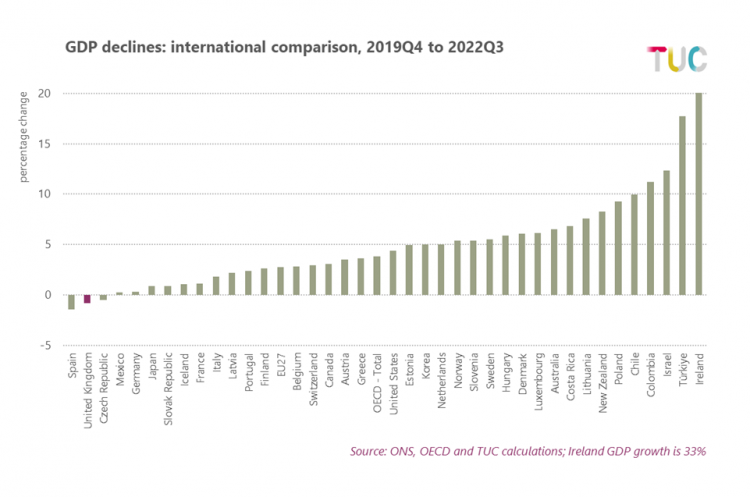
On an international view of GDP outcomes since the start of the pandemic the UK is second to last of all advanced economics, and one of only three where in 2022Q3 GDP was still below the pre-pandemic level.
- 40 https://www.ft.com/content/17f5fcb0-b734-4c29-8b25-52b5597701a3
- 41 https://www.bankofengland.co.uk/speech/2023/january/huw-pill-chair-and-general-discussant-at-the-american-economics-association-annual-meeting
- 44 Monetary Policy Report, Nov. 2022: https://www.bankofengland.co.uk/monetary-policy-report/2022/november-2022
But the likelihood of recession is far from unique to the UK. The World Bank’s annual ‘Global Economic Prospects’ warns that the world is "perilously close to falling into recession”. 43
b. The policy response to date
Policymakers justly point at Putin’s illegal war and supply bottlenecks as the cause of inflation, but the policy reaction belongs to central banks and other policymaking institutions. In the UK, it belongs also to government. In October 2022, at the annual meeting of the IMF and World Bank, Director-General Kristalina Georgieva warned:
- Policymakers have an incredibly narrow path to walk—there is no room for missteps. Get it wrong and the challenges of the present could mutate into worse problems – prolonged low growth, entrenched inflation, or even sovereign debt crises with the risk of contagion.
She also observed that the weakest have been hit hardest:
- More than 60 percent of low-income countries and over 25 percent of emerging markets are in or at risk of debt distress. This will only get worse if interest rates rise further, the dollar gets stronger, and capital outflows increase. 44
As discussed in Box A, fiscal and monetary policy action is motivated less by inflation itself and more by the threat of wage–price spirals – yet these spirals are not evident. Huw Pill talks of the UK situation specifically as exceptional, but, as shown above, UK real wage growth is now, and expected to continue to be, among the lowest of all advanced economies.
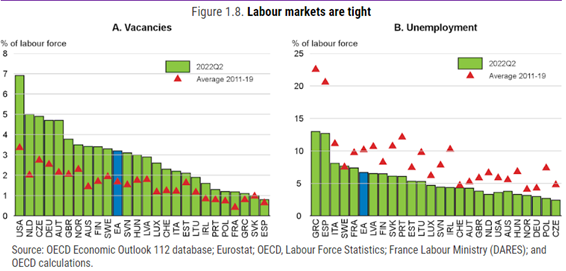
More generally there is very limited evidence that conventional measures of tightness indicate disproportionately higher wage inflation. In their latest Economic Outlook, the OECD show comparisons between the latest and longer-run (average over 2011-19) outcomes for vacancies and unemployment. On both of these standard measures of ‘tightness’ (OECD figures shown below), the UK (here ‘GBR’) is showing higher pressures than most countries – with higher-than-normal vacancies and lower-than-normal unemployment.
The same section of the Economic Outlook also includes a more up to date quarterly measure of real wage inflation (year to 22Q3, Figure 1.9). The charts below compare these figures with the measures of labour market tightness. Specifically for the UK, while both measures indicate one of the tightest labour markets real wages are firmly in the middle of country outcomes. More generally across all OECD countries vacancies have increased significantly, yet this measure of real pay has still fallen in all countries except Hungary. Moreover it is not the case at the moment that higher vacancies are associated with higher pay growth, the correlation is zero when comparing between OECD countries.
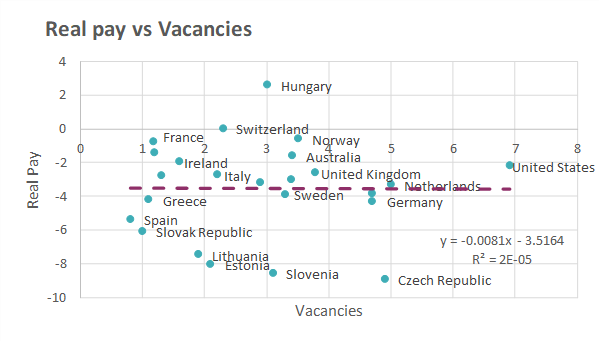
The same results follow on the unemployment measure. Across all countries there is only the slightest evidence that low unemployment is associated with less bad pay outcomes. And any relationship that exists is nullified if Hungary, Greece and Spain are ignored as outliers.
The results echo previous TUC analysis looking at wage growth against labour market tightness by industry in the UK. This also found very little correlation between the industries getting pay rises and the level of labour market tightness measured by vacancy rates. 45
Tight labour markets do not automatically lead to wage rises, particularly in a context where workers’ power to negotiate through their trade unions has been under attack. Employers have been reluctant to respond to labour shortages with the kind of pay increases workers need – except where these have been negotiated by unions. Since the Autumn Statement the main risk is shifting increasingly from inflation to recession. Under these conditions protecting workers from inflation, will also serve to support the economy by sustaining expenditure. Doing the reverse will worsen the recession.
c. Austerity 2.0 and the doom loop in GDP
Thirteen years on, the failure of the government approach to macroeconomic policy is undeniable. As economists Jo Michell and Rob Jump demonstrated in a paper before the Autumn Statement, the rhetorical device of a ‘black hole’ in the public finances is not reflected by the economic reality. 46
A paper issued alongside this submission for a TUC conference outlines the wider and more devastating doom loop process. 47
The chart below shows various iterations over time of the Office for Budget Responsibility (OBR) forecast (and the Nov. 22 forecast by the Bank of England). The latest projection for real GDP (in blue) shows the size of the economy in 2023 is expected to be £2.2 trillion (in 2019 prices); this is £400bn or one sixth smaller than a projection of the OBR forecast made in 2010 (in purple). If the economy had followed the pre-global financial crisis trajectory (from 1981, in orange), the size of the UK economy in 2027 would be £3.2 trillion.
- 45 JobsandrecoverymonitorPAY2.pdf (tuc.org.uk)
- 46 ‘The dangerous fiction of the “fiscal black hole”’, Rob Calvert Jump and Jo Michell, 10 Nov. 2022, https://progressiveeconomyforum.com/publications/the-dangerous-fiction-of-the-fiscal-black-hole
- 47 Text for footnote
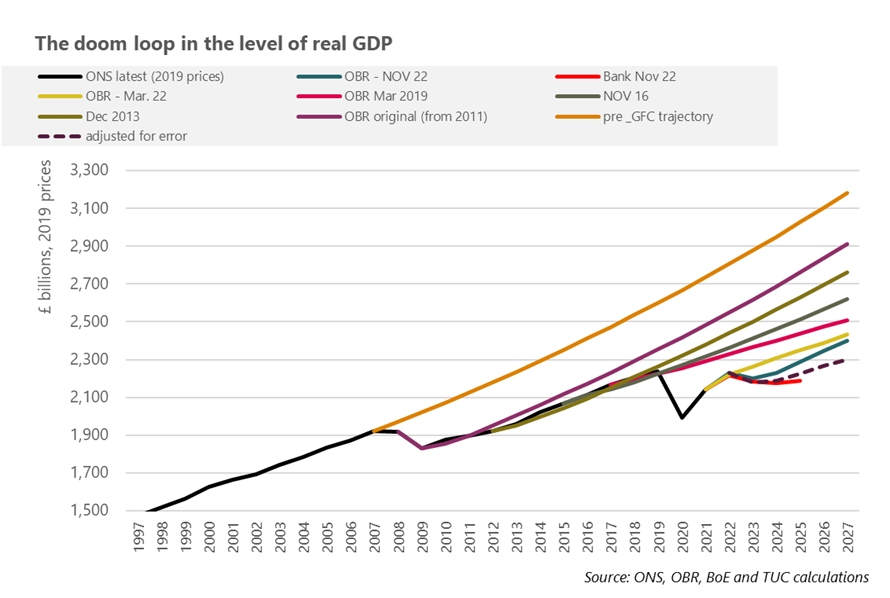
This dysfunction has been progressively intensifying since Chancellor Osborne began austerity policies in 2010. With only a handful of exceptions, each OBR forecast for the level of real GDP is worse than the previous one (for clarity not all forecasts are shown on the chart). The OBR recognise uncertainty in their forecasts, but there is very little uncertainty here: over time forecasts are revised down.
According to the ‘doom loop hypothesis’, this is because the mechanisms at play – inadvertently perhaps – contain the expansion of the economy. Adjusting the forecast for the average downgrade suggests by 2027 the outturn will be £2.3tn, £900 billion lower than the pre-crisis trajectory.
A full account of the hypothesis is included in the TUC report; the essential steps were outlined in section 4 above, and illustrated on the graphic below. Critical to the doom loop is also the idea that at each iteration, the OBR wrongly attribute the reduced growth to a failure of supply (productivity) rather than demand (austerity).

The public finances will get worse not better without change. TUC have shown austerity 1.0 led to the weakest recovery and worse public finance outcome for 100 years. The pay crisis is then a result of the economic crisis.
But we were not ‘all it together’ as originally claimed. Alongside Congress 2022 TUC issued a report showing that the global financial crisis, dividends have increased three times faster than wages 48 . In spite of the usual rhetoric around hard decisions, at the Autumn Statement the Chancellor managed to lift a corporation tax surcharge for banks and the Prime Minister is still seeking to remove the bonus cap for bankers. New TUC analysis shows a record year for bankers’ bonuses, accounting for £18.7bn in the finance and insurance industry. 49 The figure is well above estimates for the costs of an inflation busting pay rise for public sector workers. 50
In the new report we show a longer view of the dislocation between wealth and labour. The chart below compares the doom loop in GDP outcomes, against a so-called ‘boom loop’ in asset values. 51
- 48 TUC (2022) Companies for People – How to make business work for workers
- 49 https://www.tuc.org.uk/news/city-pay-has-risen-more-three-times-faster-nhs-key-worker-pay-2008
- 50 In a discussion of Treasury estimates, the BBC report the Institute for Fiscal Studies suggesting the cost is “more like £14 billion”: https://www.bbc.co.uk/news/63917967
- 51 Source: see n. 47
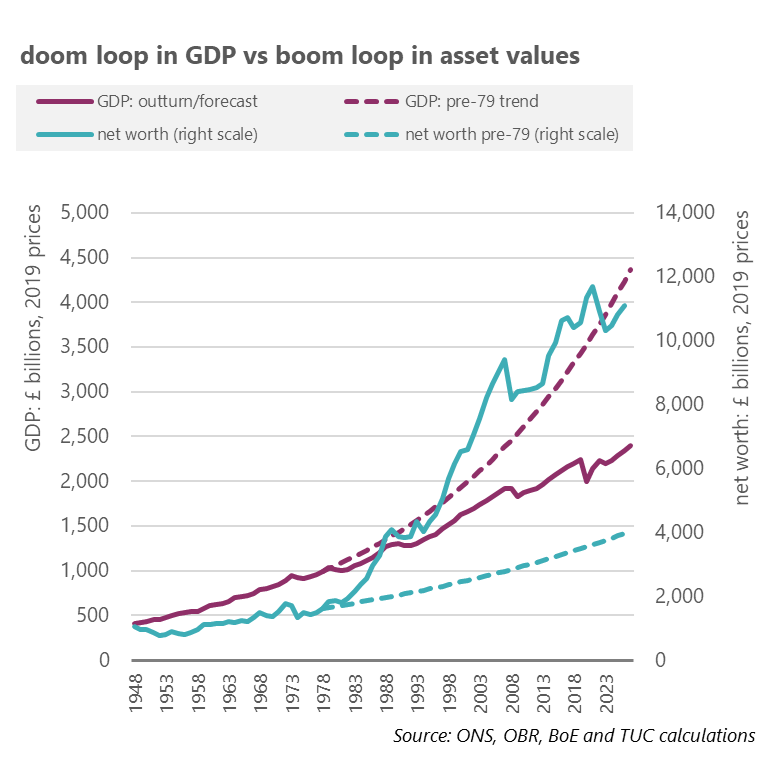
pre-1979 trend:
- GDP will have lost £2tn or nearly half the ground compared to the previous trajectory and
- wealth will have gained £7tn, or by more than three times.
These vast asset gains are matched at a global level by parallel increases in private and public indebtedness across the world. With this balance sheet expansion not supported by production, there is a significant risk that the present arrangement is unsustainable.
The paper outlines the alternative macroeconomics of an economic model with the balance reset in favour of work and away from wealth. These policies have a substantial international dimension, given wealth inequalities and failures of work are no less apparent between as well as within countries. Europe and North America account for ten per cent of the world population but 57 per cent of global wealth. Issued for the media circus around Davos, Oxfam report the richest 1% have pocketed $26 trillion (£21 trillion) in new wealth since 2020, nearly twice as much as the other 99 per cent of the world’s population. 52
Stay Updated
Want to hear about our latest news and blogs?
Sign up now to get it straight to your inbox