Spring Budget 2023
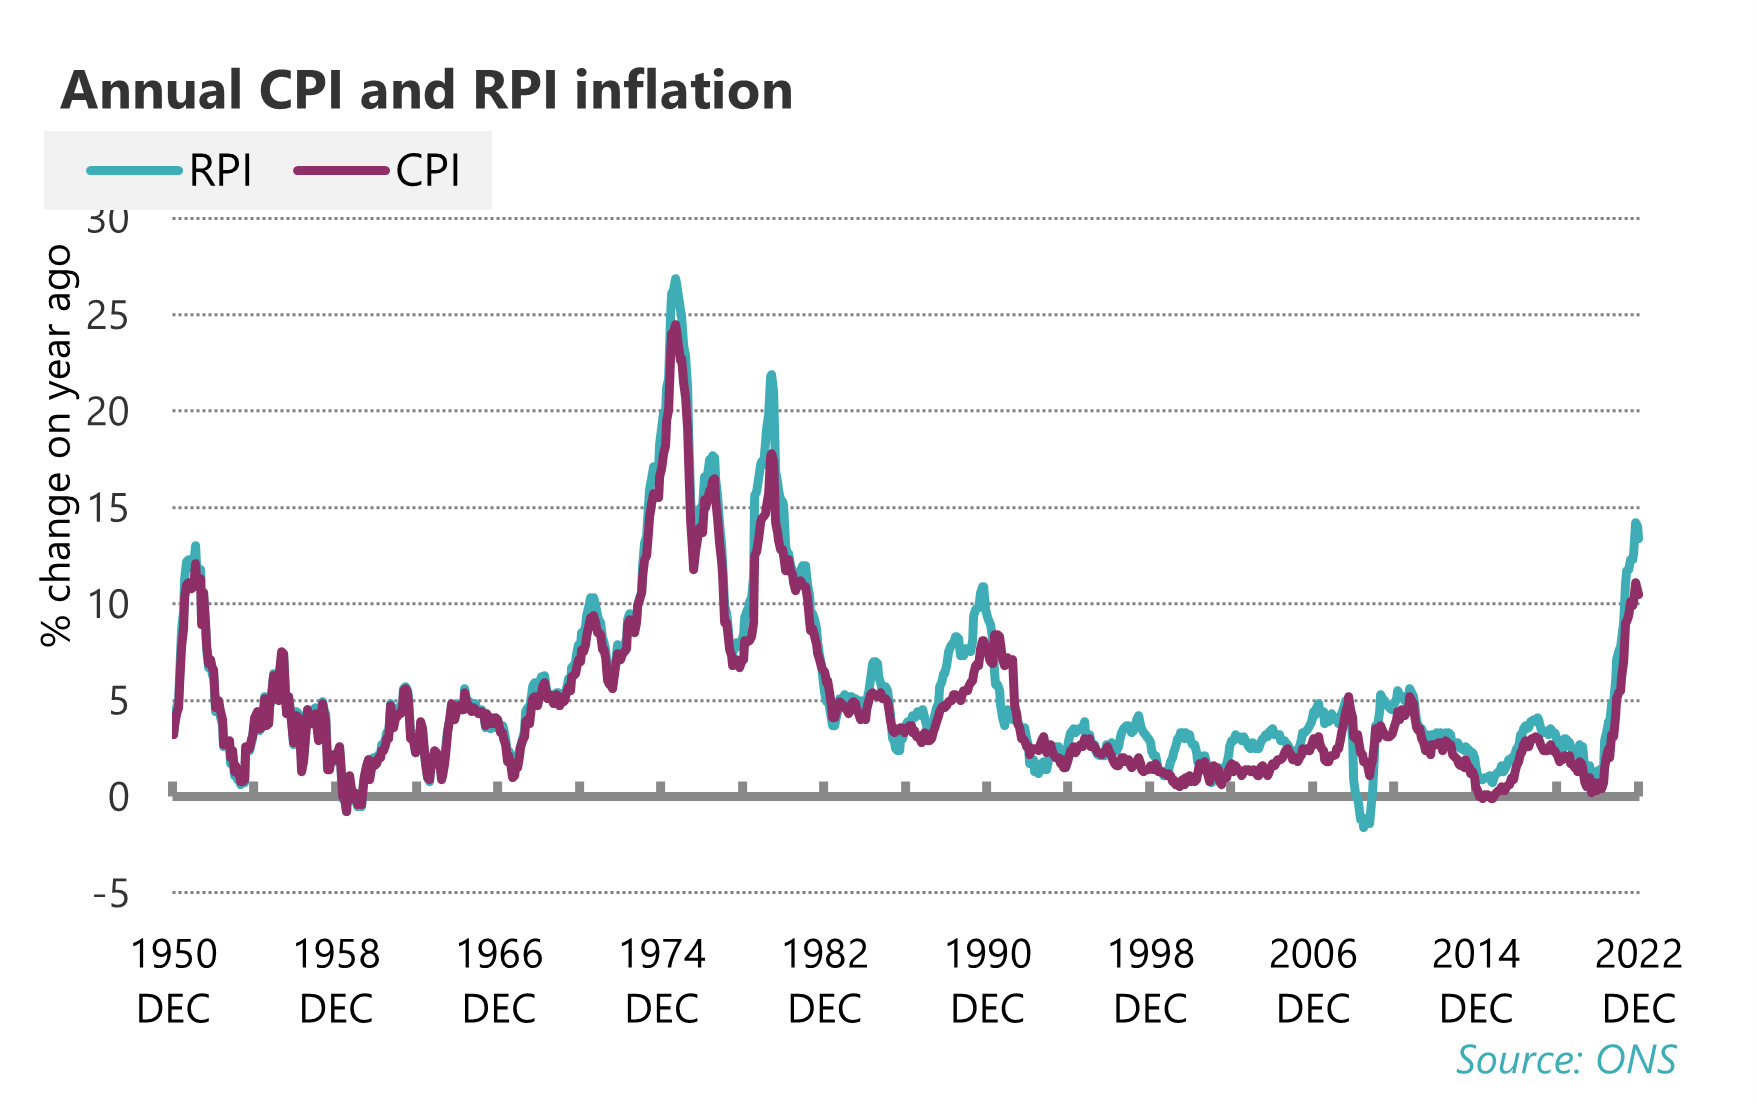
Challenging under any circumstances, the government have ensured workers could not be worse placed to handle the biggest inflation for 40 years. In December 2022 CPI inflation was 10.5 per cent and RPI 13.4 per cent. Food inflation is now 16.8 per cent, the highest for 45 years; and energy bills have increased brutally, with gas inflation at 129 per cent and electricity at 65 per cent.
The government’s current proposed response to this inflation is to impose the same austerity dogma, once more seeking to restrain spending on pay and public services, with the Chancellor promising “restraint on spending… to make a lower tax economy possible” in his recent Bloomberg speech.25
For more than a decade public sector workers have suffered government imposed cuts, freezes and caps, and now face even worse pressures as a result. As we saw from 2010 onwards, austerity simply delivered worse outcomes for the country as a whole:
- reduced public sector pay reduced spending in the economy
- reduced spending reduced economic growth overall,
- reduced economic growth resulted in lower private sector pay, and
- reduced economic growth and lower pay meant lower tax revenues, and
- the publics finances were not been repaired.
In January 2021 Laurence Boone, chief economist of the OECD, commended government stimulus in the wake of the global financial crisis, and warned: “The mistake came later in 2010, 2011 and so on, and that was true on both sides of the Atlantic … The first lesson is to make sure governments are not tightening in the one to two years following the trough of GDP”. 26
Beyond the false macroeconomics of austerity, the government makes various other arguments – these are discussed in Box A below.
Box A: The Treasury evidence to Pay Review Bodies
In addition to failed austerity imperatives, the Treasury make various other contentious claims in their latest evidence to the pay review bodies. Above all warnings of a wage-price spiral sit oddly with the idea that the “expected recession” will “contribute to normalisation of nominal pay growth”.
Not for the first time, there are appeals to the self-defeating notion of parity between public and private sector workers. In their own terms these amount to a mechanism for levelling down: public sector pay must be cut because of an alleged premium over private sector workers (their Figure 3.A). Today the claimed premium extends beyond pay to pension provision and job security. But any such appeal fails to account for the bonuses paid to workers in the private sector. TUC analysis of the financial and insurance sector found City pay rising six times faster than average wages.
Many authors have in the past contested these aggregate comparisons as inappropriate because of the different types of work in the public and private sectors. There is a wider range of pay in the private sector. Sectors such as finance and manufacturing enjoy a premium when compared with the public sector but overall earnings are pulled down by low pay in hospitality, catering and retail. Jobs in the public sector typically require higher level of qualification. Superficial pay comparisons fail to account for this and the different demographics between public and private sector workforces, such as age, gender, role and responsibilities.
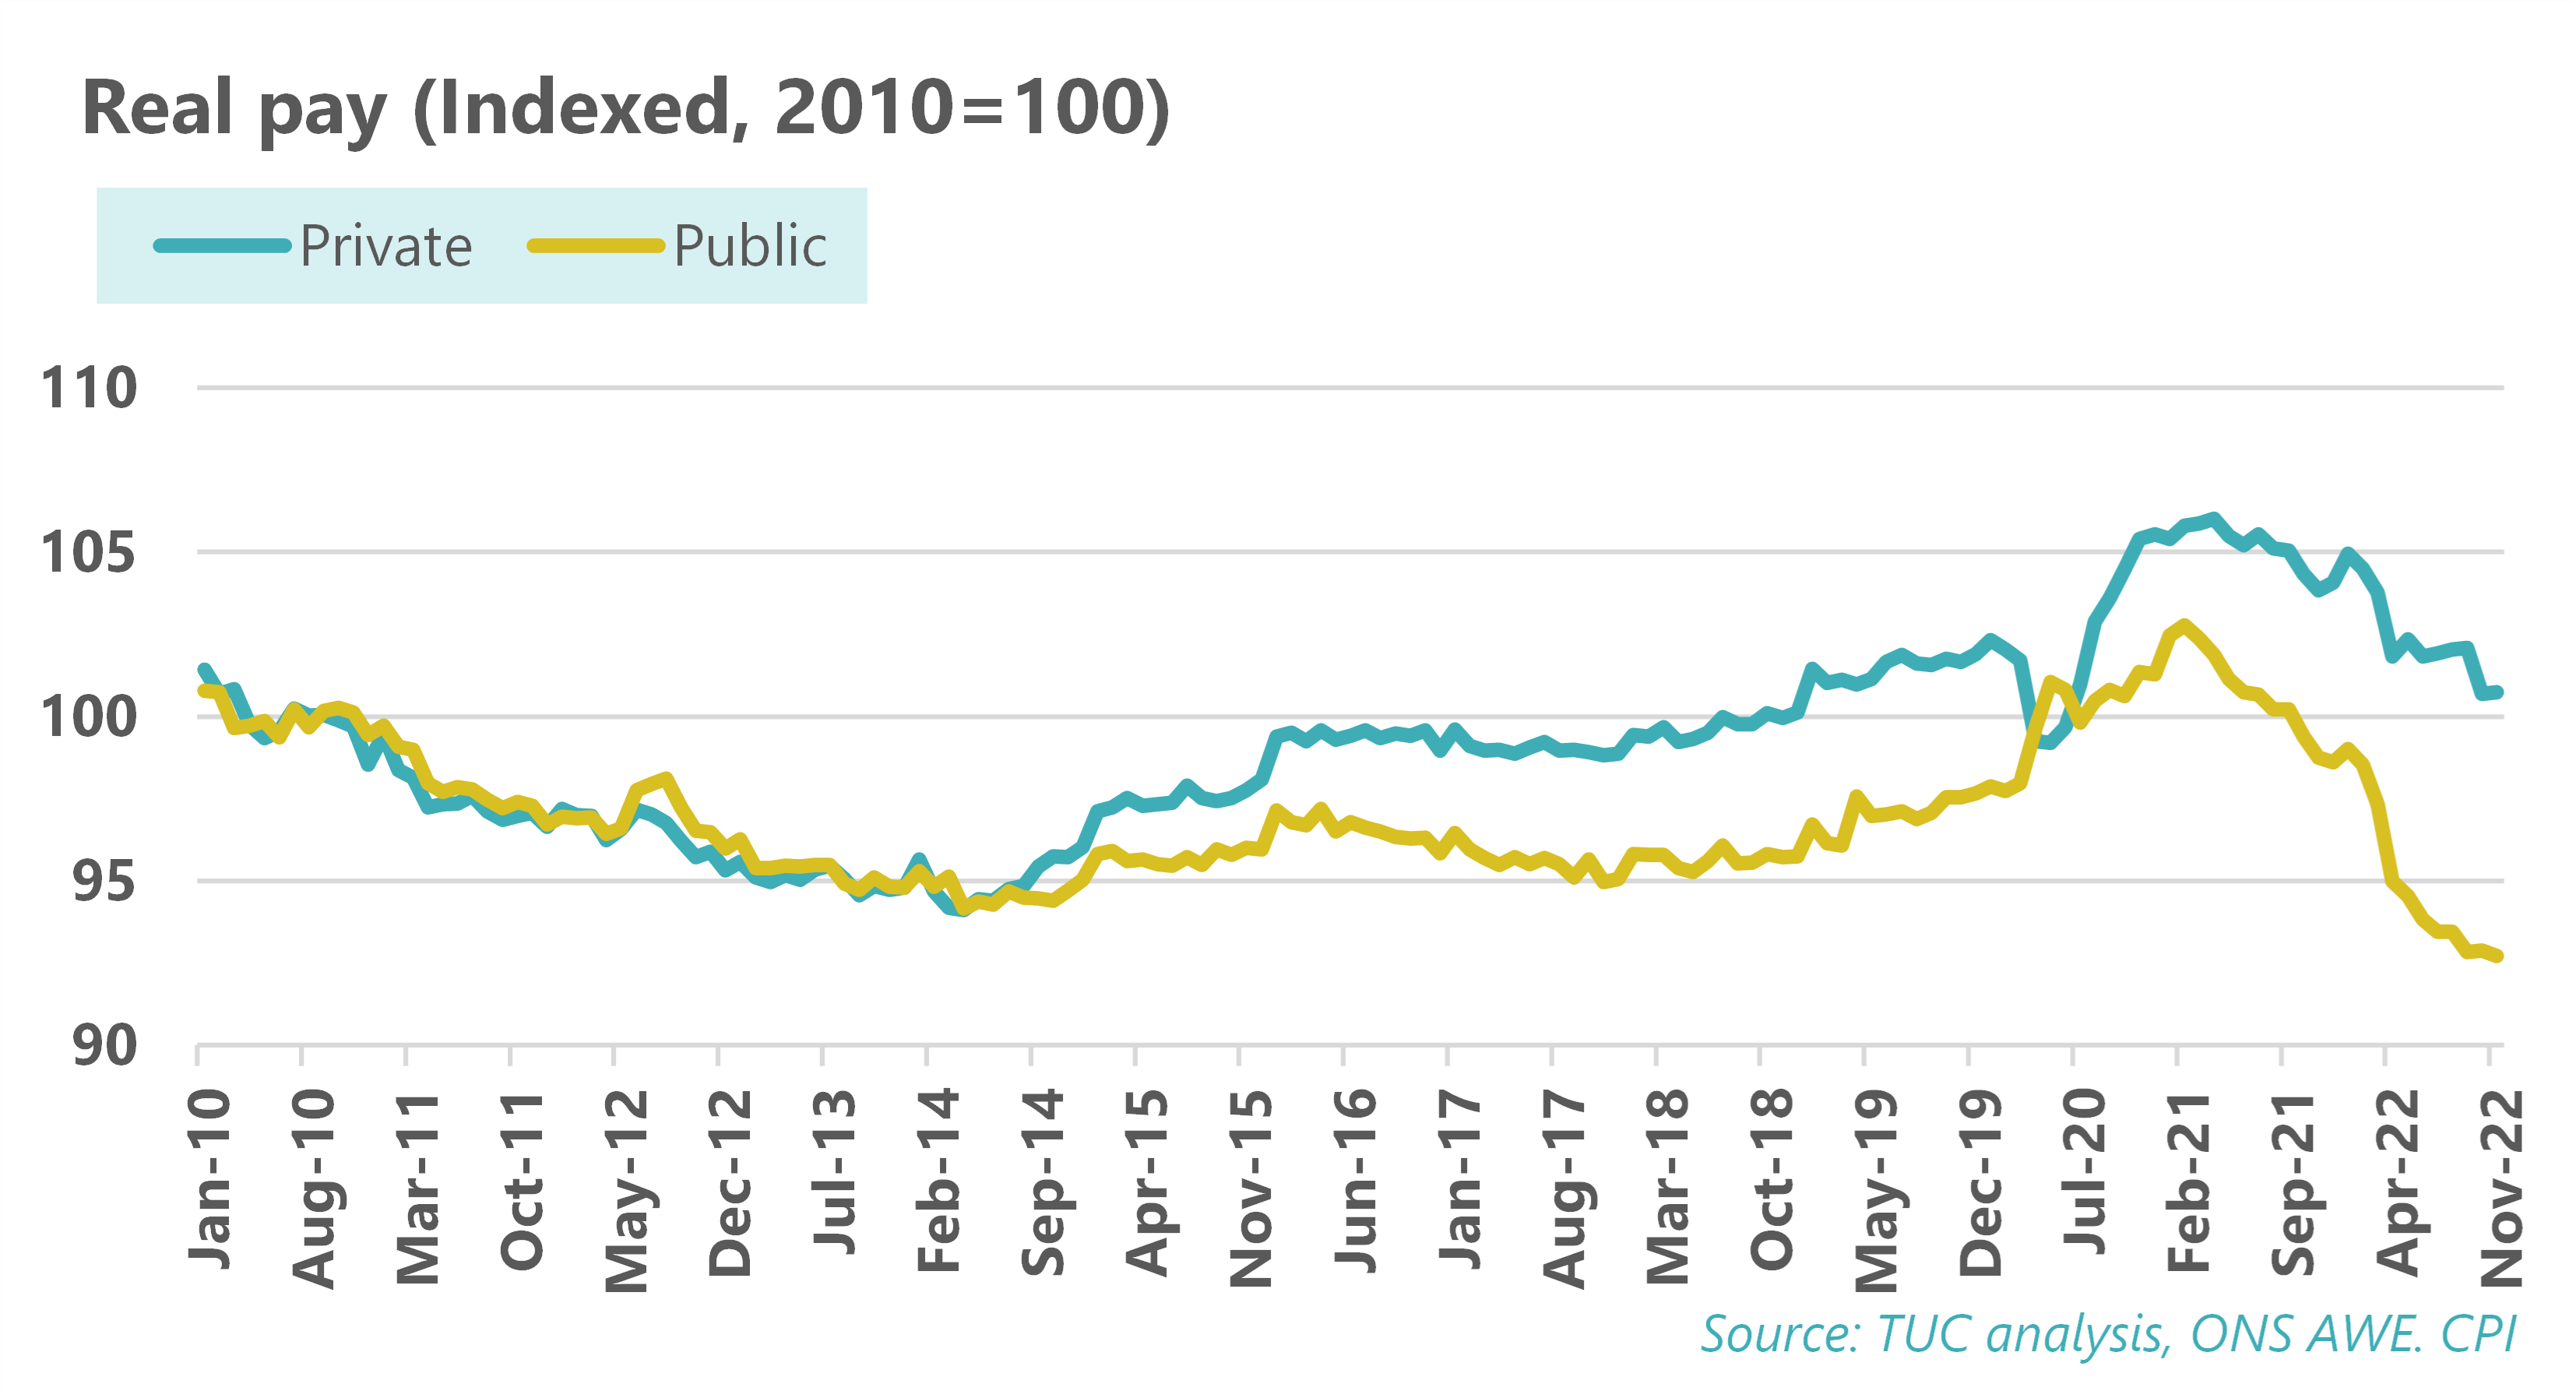
But, of course, attempts to level down public sector workers is equally counterproductive for private sector workers. The chart below shows the level of real pay in the public and private sectors indexed to 2010. As public sector pay was cut, private sector pay followed suit; conversely private and public pay moved up together from the bottom. The latest wage data shows private sector pay barely above the level it was 12 years ago, and currently declining. And public sector real pay has declined far beyond the previous lowest level.
With real pay collapsing at an unprecedented rate, the idea of a wage price spiral is only a danger in theory. Even their own assessment is very half hearted – “There is uncertainty around the magnitude of any wage –price spill overs in the public sector, but it is a risk the government cannot ignore” (para 3.10). As the Treasury separately argue, recession will wholly change the situation. Appealing to corresponding concerns at the Bank of England concerns does not make the situation a reality. Likewise citing the Bank for International Settlements support for policy, is another fear of a spiral in theory – and the BIS conceded “To date, there is limited evidence that most AEs are entering a wage-price spiral” (p. 5). The Treasury did not cite the IMF, who concluded: “Historical episodes in advanced economies exhibiting wage, price, and labor market dynamics similar to those of the current circumstances—in particular, economies in which real wages (nominal wages deflated by consumer prices) have been flat or falling—did not tend to show a subsequent wage-price spiral”.
Likewise the Treasury use of figures is selective, for example dwelling on settlement data rather than official data for private sector pay growth. More substantially the past has been erased. The pay review body “’uplifts’ for 2022-23 may have at the time been the highest “in nearly twenty years”, but inflation has got worse since the PRBs met and even more importantly the bar is a low one against the worse outcomes for 200 years.
The Treasury justly report the better earnings performance at the lower end of the pay distribution (Figure 3.D), but this follows at least in part increases to the minimum wage and reenforces the case for levelling up not down.
More generally many – including quite unexpected figures – have contested the wider economics of public sector spending and inflation. The former permanent secretary to the Treasury, cited a David Smith piece in the Sunday Times: “Public sector workers don't cause inflation: their wages lag the private sector's. The problem for HMG and its workers is that its public finance strategy rests on imposing the biggest real wage cuts in living memory”. Smith himself observes: “There is little danger that higher public sector pay settlements would trigger a wage-price spiral”. Willem Buiter, a founder member of the Monetary Policy Committee, went as far as “Thatcher would give massive pay rise to public sector workers”. Another founder member, Charles Goodhart, warned of “a year of discontent unless they agree a wage deal to end the ongoing industrial action.”
Even the Treasury use of trade union position is a misrepresentation. Current inflationary pressures may be a key factor in the ongoing industrial action, but this is far from the only reason. Likely the main reason is fifteen years of cuts that have ruined salaries and destroyed public services, and in certain areas the consequent risk to the public.
In effect policymakers are prioritising a spiral in theory over the very real threat of recession, and the immense damage it will cause not least to people who already can’t afford to live. Moreover even the theoretical conditions for a wage price spiral are different to the present situation. Fundamentally this is not the 1970s. Wages are following prices, and still at a good distance and certainly not spiralling. Workers are (in part) seeking to keep up with a sharp increase in the cost of living, not themselves forcing the standard of living higher. Labour is not motivated by greed but by hardship. The injustice is amplified given the vastness of wealth (section 6.c).
References
Bank for International Settlements; Wilhem Buiter on Bloomberg; Charles Goodhart;
HMT evidence; IMF World economic outlook; MacPherson; James Meadway, Open Democracy;
David Smith in The Times; TUC: City bonuses are rising six times faster than wages | TUC
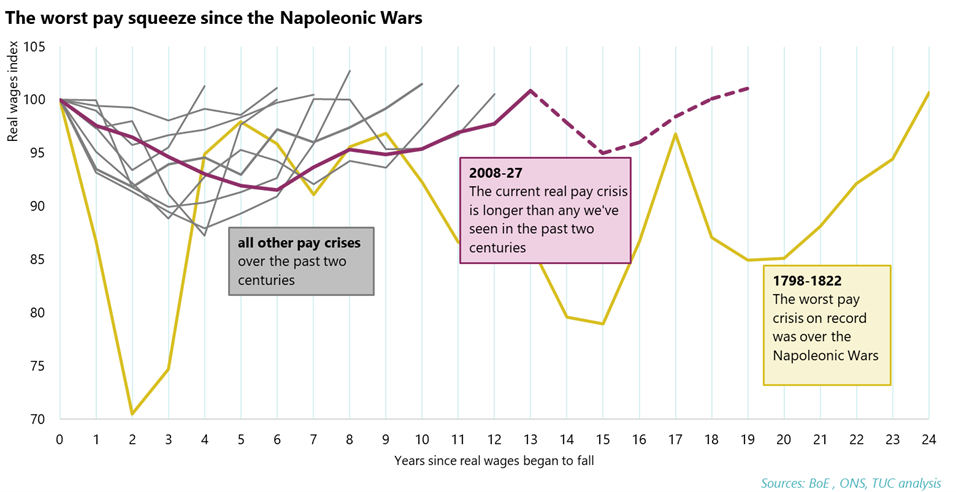
Overall, across both public and private sectors the impact of government policy is a severe real pay crisis. The chart below compares the current real pay decline with all other comparable episodes since the start of the nineteenth century. Even ahead of the present inflation, the current crisis was the worse since the Napoleonic Wars. Together the resumed declines in 2022 of 2.9 per cent and 2023 of 3.0 per cent are the steepest for fifty years (years 14 and 15 on the chart). On current forecasts (which have repeatedly proven optimistic – see section 6.c) the crisis is not expected to end until 2027, nineteen years after the start in 2008.
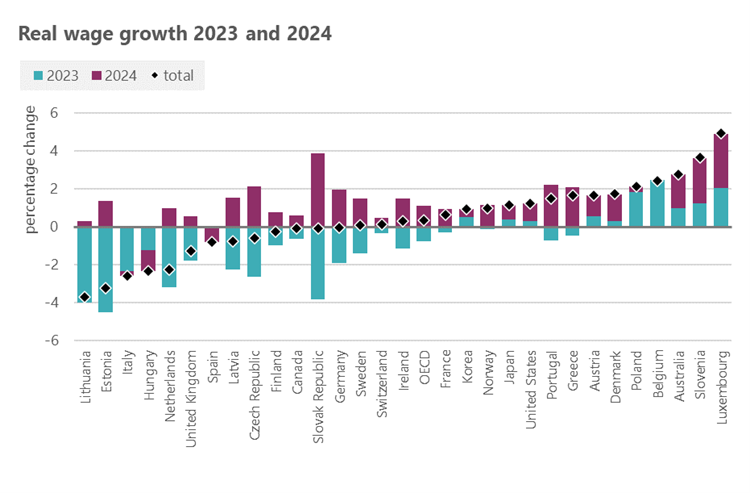
While pressures on prices are affecting all countries, the UK’s real pay performance is particularly bad. The ILO report that real wages fell in advanced G20 countries by 2.2 per cent in the first half of 2022, the first global decline since its records began.[1] They note that of G20 economies only Italy, Japan, Mexico and the UK have real pay below 2008 levels. And looking forward UK wages are under more pressure than most other advanced economies. The OECD forecasts a UK real wage decline from 2022 to 2024 of 1.3%, the sixth worse of the advanced economies on the chart below. 27
The OECD average is up 0.3% - the UK has both a steeper decline into 2023 and smaller rise into 2024.
- 27 ILO, Global Wage Report, 2022-23
In November 2022 public sector real pay fell by 6.7 per cent (on CPI), declining at twice the rate of private sector pay. As illustrated in section 3, this has led to recruitment and retention crises across the public sector.
Stay Updated
Want to hear about our latest news and blogs?
Sign up now to get it straight to your inbox