Lessons from a decade of failed austerity
A decade on from the global financial crisis, the British economy faces increased risk of renewed recession. Alongside weak domestic growth, global economic growth is at its weakest since the crisis and the risk of a no-deal Brexit remains high.
Any preparation for recession must involve learning the lessons of the government response to the last one.
This paper shows how the cuts imposed after the last recession, both in the UK and in much of the developed world, harmed economic growth, with a heavy impact on workers’ pay.
Overall, pay growth has halved across OECD countries in the decade since the GFC. In real terms, annual pay growth has been below one per cent a year for two thirds of countries.
Policymakers and politicians wrongly attribute this entirely to ‘productivity’, despite a failure to find convincing supply-side explanations for the change in growth at a time when controversial policies are acting on demand.
Calls for government expenditure in the face of renewed recession are already widespread, but ‘austerity thinking’ still constrains the options for fiscal policy going forwards.
Recommendations
- The government should ask for an independent review of how the Office for Budget Responsibility and Bank of England judge the impact of government expenditure on the economy, assessing the critical assumptions on multipliers, the output-gap and the ‘NAIRU’ given the international experience of the austerity decade.
- Immediately deploy fiscal policy to support aggregate demand according to this changed view, expanding government (current) expenditure on public sector salaries and services.
- Fast-track increases in public infrastructure spending to the OECD average of 3.5 per cent of GDP.
- Increased expenditure should be financed by borrowing rather than increased taxation in the first instance. This is not equivalent to deficit spending, as a stronger economy will improve the public sector finances.
- Use fiscal policy as part of a wider plan to deliver sustainable growth across the UK, including investing in the public services families rely on, the skills workers need for the future, a just transition to net zero carbon emissions, and giving workers a real voice at work.
Download full report (pdf)
A decade on from the global financial crisis, the British economy faces increased risk of renewed recession. Alongside weak domestic growth, global economic growth is at its weakest since the crisis and the risk of a no-deal Brexit remains high.
The political and policy context is evolving. In the UK and other countries fiscal policy is on a more expansionary setting, and there are calls for formalising a more enhanced role.
These changes are welcome. But ‘austerity thinking’ still constrains the options for fiscal policy going forwards. There is no sense that austerity was the wrong policy; the media still demands ‘how will it be paid for’ of any spending announcement; and policy recommendations by international organisations are still conditioned on faulty ideas of ‘fiscal space’.
For example, the Institute for Fiscal Studies simply add recent spending announcements (of £13.4bn) to existing estimates for government borrowing. Austerity thinking is the logic of the household budget and omits the impact of government policy on the economy.
On a macroeconomic view government spending strengthens the economy and can improve rather than damage the public finances. Over the past decade, increased public debt ratios demonstrate operating this thinking in reverse.
This paper shows how the cuts imposed after the last recession, both in the UK and across most advanced economies, harmed economic growth, with a disastrous impact on workers’ pay.
On average, pay growth has halved across OECD countries in the decade since the GFC. In many countries the standard of living is at best static. Jobs growth has been relatively robust, slowing only moderately, and above one per cent annually on average. In the UK there is now a fundamental challenge: for too many, work is no longer providing a way out of poverty.
Policymakers and politicians wrongly attribute this entirely to ‘productivity’, despite a failure to find convincing supply-side explanations for the change in growth at a time when controversial policies are acting on demand.
On a global view the wider policy mix of fiscal restraint and monetary ease has also led to renewed imbalances. Growth has been unduly reliant on external demand; global private debt has expanded while austerity has not resolved public debt.
Rather than take the crisis as an opportunity to do something different, long-standing policy agendas have been intensified. The perceived needs of finance and the wealthy have been put first. Even as spending was supported to get out of crisis, austerity was championed as the other end of policy. Labour markets have been further deregulated, protections and benefits withdrawn, and a greater element of coercion imposed. On the other hand, wealth has been supported by QE and various subsidies directed at the financial sector (chapter 1).
A decade later, nothing is resolved. Austerity has weakened economic growth much more than expected; and public debt is not reduced. Moreover, the fragilities that led to the global financial crisis (GFC) are not resolved. While the dangers are widely understood, policymakers have not been able to prevent resumed private debt inflation on a global level.
But worse still, there is no admission of failure. The analytical technique used to assess outcomes assumes policy is not at fault. This results in failures of demand in the economy being interpreted as failures of supply.
The report sketches out labour market outcomes across the OECD (chapter 2) and then focuses on an alternative technique to assess directly the impact of reduced government spending on the economy.
The approach is largely based on charts of aggregate OECD experience and individual country performance, with UK outcomes emphasised throughout. Generally, growth is compared before and after the crisis, because in austerity policies (for most advanced economies) have operated on the growth of government spending. Some data are included in an annex for reasons of manageability.
Labour market outcomes are understood in the context of changes to growth of the expenditure and income measures of GDP. The analysis shows how the impact of cuts to government spending have significantly damaged rather than improved overall growth. With domestic demand reduced there has also been a relatively greater reliance on global trade, which is partly motivated by QE (chapter 3). The income measure of GDP motivates an explanation of how productivity is effect not cause of outcomes, and the implications for capacity – i.e. the output gap and ‘NAIRU’ – are addressed (chapters 4 and 5). Rather than operating near capacity, the world economy has been greatly contained for a decade.
Periodic efforts to tighten monetary policy expose ongoing financial fragilities, and hence the longer-standing vulnerabilities arising from private not public debt (chapter 6). These are symptomatic of the longer-standing orientation of the economy towards wealth and speculative ventures rather than productive activities.
The social imperative for immediately increased public expenditure and strengthened worker protections is equally a macroeconomic imperative (chapter 7). Broad recommendations for an expansionary fiscal policy are set out:
- The government should ask for an independent review of how the Office for Budget Responsibility and Bank of England judge the impact of government expenditure on the economy, assessing the critical assumptions on multipliers, the output gap and the ‘NAIRU’ (non-accelerating inflation rate of unemployment’) given the international experience of the austerity decade.
- Immediately deploy fiscal policy to support aggregate demand according to this changed view, expanding government (current) expenditure on public sector salaries and services.
- Fast-track increases in public infrastructure spending to the OECD average of 3.5 per cent of GDP.
- Increased expenditure should be financed by borrowing rather than increased taxation in the first instance. This is not equivalent to deficit spending, as a stronger economy will improve the public sector finances.
- Use fiscal policy as part of a wider plan to deliver sustainable growth across the UK, including investing in the public services families rely on, the skills workers need for the future, a just transition to net zero carbon emissions, and giving workers a real voice at work.
In the wake of the crisis, policymakers merely intensified a failed model. A decade on, the debate should concern how to aim the system at the needs of workers and businesses, rather than the wealthy and finance. A longer perspective shows that we have done much better in the past (chapter 8).
“Worst of all is the orthodox theory that bad trade calls for economy – economy in all new development, both public and private, economy in bankers’ loans, economy in wages, economy in social services, economy in employment, economy in enterprise, ‘freedom from thought.’ This disastrous doctrine dominated British policy between the wars … The Labour Party was right when it declared that this was the exact reverse of the truth, and that the supposed cure only made the disease worse.” [1]
The Labour Party of 1944 castigated the notion of ‘economy’; policymakers in 2010 spoke of ‘consolidation’; most people talk about ‘austerity’. The Coalition government resurrected various soundbites: an economy ‘living beyond its means’; calling for ‘good housekeeping’ and ‘cutting one’s coat to fit one’s cloth’. They fell in line with a global appeal, with the OECD arguing in November 2009:
Credible medium-term consolidation programmes should be announced already now, in order to strengthen market expectations about the determination of governments to return to sustainable fiscal positions. (p. 63)[2]
The economic ideal was rebranded as ‘expansionary fiscal contraction’, infamously associated with the Harvard economist Alberto Alesina. Amounting only to the old wine of ‘crowding out’ in a new bottle, getting government out of the way is meant to strengthen private sector activity.
The doctrine translates in practice to cuts in spending on public sector investment, wages, services and social security payments. In parallel, increased flexibility was demanded (even enforced) of the workforce. The IMF were categorical:
[1] ‘Full Employment and Financial Policy’, Report by the National Executive Committee of the Labour Party to be presented to the annual conference to be held in London from May 29th to June 2nd, 1944, The Labour Party, Transport House, Smith Square, London S. W. 1
[2] OECD (2009) Economic Outlook, 86, Nov.
Limiting the extent of job destruction will require slower wage growth or even wage cuts for many workers … In addition, many of the structural reforms … [we] have emphasized to improve the flexibility of labor markets remain relevant, possibly even more so to raise medium-term prospects after a damaging crisis.[ 3]
In the UK this was the cue for savage cuts to welfare spending and the Trade Union Act.[1],[2]
The approach to the finance sector has been very different. After the original rescue packages, quantitative easing facilitated (potentially high-risk) activity and schemes like ‘funding for lending’ and ‘help to buy’ have subsidised bank lending.
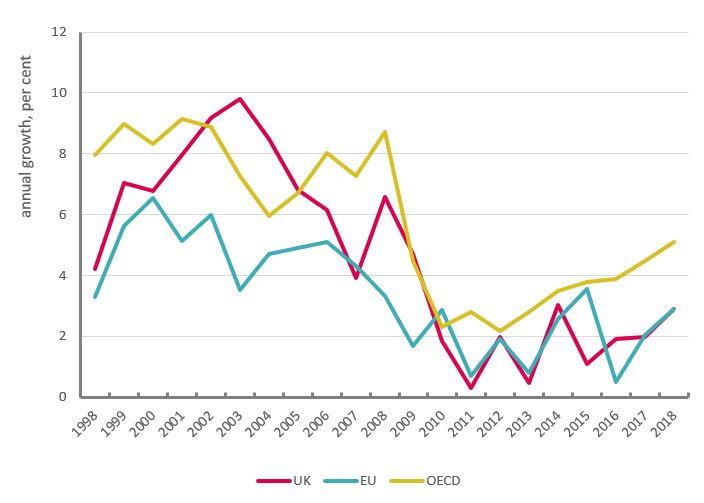
The most concrete measure of austerity is government expenditure, with the most readily available statistics for ‘general government final consumption expenditure’ (i.e. excluding investment and welfare payments). Figures 1 and 2 also introduce the graphical approach used throughout the paper: first a time series of country groupings (OECD and euro area) with the UK; and then a comparison across all OECD countries of pre- and post-crisis growth, excluding the global recession. Other points to note are that much of the analysis is done in cash terms; OECD averages are either weighted by country size (‘total’) or simple averages across countries (‘average’).[3]
Even from the start, a degree of caution was evident. At the macroeconomic level, governments generally cut back on the growth of spending. Furthermore, cuts were moderated from 2012 as the global economy abruptly weakened. Strikingly the UK Treasury relaxed austerity by even less than the EA and has continued to maintain very low spending growth (though change is underway in 2019). Overall, across the OECD, government spending growth reduced from 7.9 per cent a year in the decade before the crisis, to 2.4 per cent over 2010-2012, and has gradually increased to 5 per cent over subsequent years to 2018.
[3] More fully: the analysis here and throughout the paper is normally based on comparing the pre- and post- crisis episodes with the crisis itself omitted, given an attempt to compare recent outcomes with (relatively) normal conditions. The analysis is based on nominal / cash figures because (i) economic activity is conducted in cash/nominal terms, (ii) government spending measures are more tractable in cash terms, (iii) the multiplier that is used for theoretical analyses of government spending (see below) is a cash conception and (iv) the public finances are measured in cash.
By country: Germany, Israel, Chile, Japan and Sweden stand apart with increased or (virtually) unchanged expenditure growth after the crisis. Spending growth has been cut in the vast majority of countries; however, only Portugal and Greece have endured actual cuts in the level of spending.
Figure 2: Government spending by country, average growth
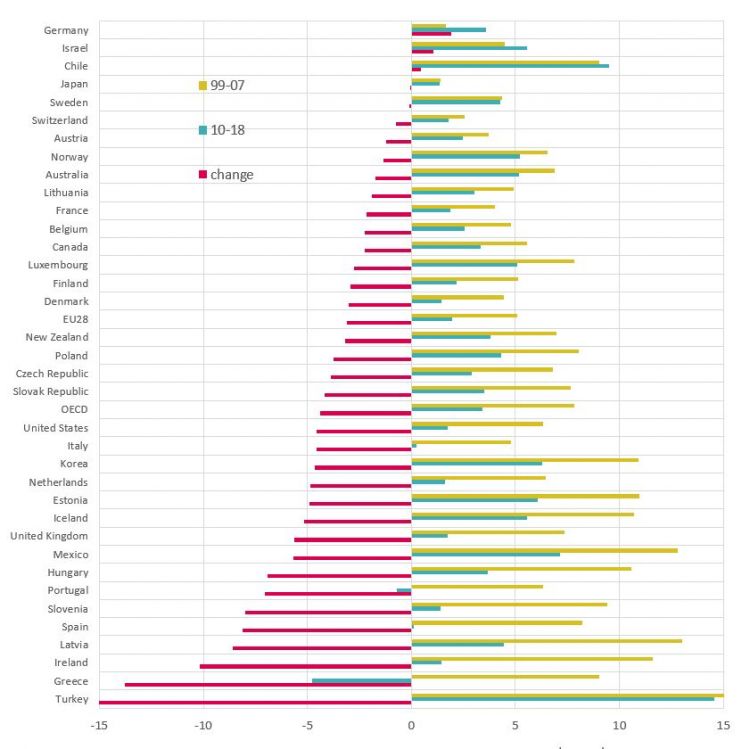
While in macroeconomic terms it is important that spending growth has generally remained positive, the present episode is exceptional because of its duration. Moreover, the actual impact on public services depends on spending keeping pace not only with inflation but also population. The Office for Budget Responsibility derive a UK measure on this basis, which shows real (current) spending per capita down 15 per cent over the past nine years and forecast to rise only 5 per cent over the next five years.[1]
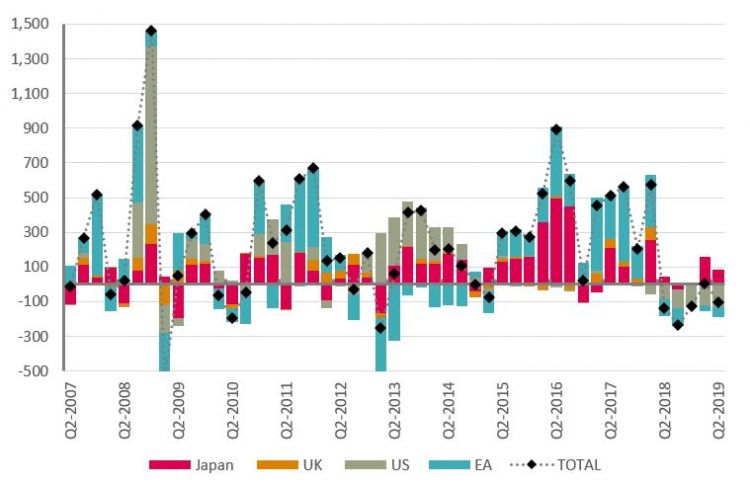
The impact of spending cuts – ‘fiscal restraint’ - has been offset by ‘monetary ease’. Central bank interest rates have been held at unprecedented low rates, and balance sheets have been expanded to a massive extent. Figure 3 below shows how quantitative easing (QE) has been shared between the major central bank (with cash amounts converted to dollars). Initially all major central banks were active. From 2013 the US and Japan took the lead. In 2015 the US stepped back, and the ECB began to take the lead. Over 2018 the US began to withdraw QE – so-called quantitative tightening (the ECB balance sheet falls because of exchange rate movements). At the time of writing, the likelihood is for resumed QE across all central banks.
[1] Supplementary fiscal tables, Table 4.3; the 2019 Spending Review sets out higher expenditure for 2020-21 but the position for future years has not been updated.
Figure 3: Quantitative easing, $billion
Wages (nominal and real)
The most obvious and direct impact of austerity has been on wages.
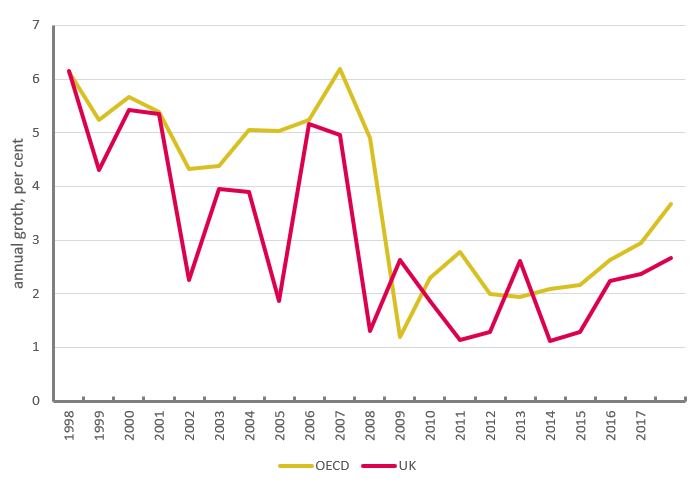
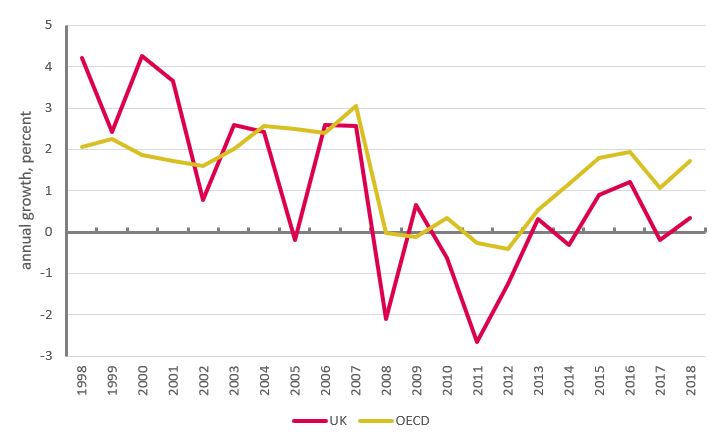
Over the past decade real wage growth has slowed by an average of a half. The OECD average ahead of the crisis was around 5 per cent and since the crisis it has been 2 ½ per cent a year. In the UK, annual wage growth basically halved from 4 per cent to 2 per cent.
Figure 3: Nominal wages, percentage annual growth
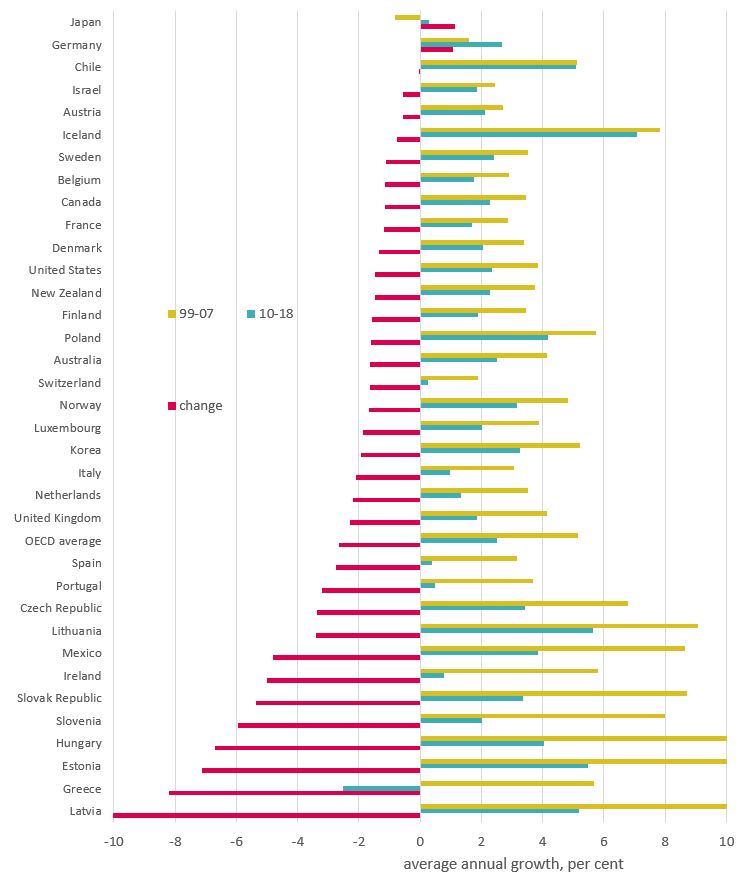
For change in wage growth, the UK is just above the OECD average. The countries with a sharper deterioration are generally understood as less advanced economies, where wages have slowed from very strong pre-crisis growth rates (with post-crisis wage growth now closer or still a little above the norm). Only Japan and Germany have done better on wages since the crisis.
Figure 4: nominal wages by country, average annual growth (%)
Real pay is the key factor for improvements to standards of living. While pay growth has halved, any reduction in inflation has been more moderate.
Overall across OECD countries CPI inflation slowed roughly to 2 per cent from 3 per cent, so OECD real wage growth is down roughly to 1/2 per cent from 2 per cent (strictly 0.9 from 2.2). Mainly because of lower pre-crisis inflation, the UK is one of the few (five) countries where inflation rose a little to 2.1 from 1.7 per cent.
Summary figures for inflation
|
|
Pre-crisis |
post-crisis |
change |
|
UK |
1.7 |
2.1 |
0.4 |
|
US |
2.7 |
1.8 |
-0.9 |
|
EU28 |
2.6 |
1.5 |
-1.1 |
|
OECD |
2.9 |
1.9 |
-1.1 |
Source: OECD
This means that UK wage growth since the crisis has gone negative at an average of -0.3 per cent relative to 2.3 per cent ahead of the crisis.
Figure 5: Real wages, percentage annual growth
Only six countries have enjoyed increased real wage growth: Chile, Israel, Japan, Iceland, Poland and Germany (in ascending order). The countries with the biggest declines are Latvia, Greece, Estonia, Lithuania and the United Kingdom (again in ascending order). Tragically Greece is in a league of its own, with real wages declining in total by 25 per cent since 2008.
Employment
Over recent years, UK employment has grown at a rapid but not exceptional pace. As the UN observe, “United Kingdom employment statistics mirror those experienced in recent years in many countries of the Organization for Economic Cooperation and Development”.[1] From 2015-2017, the UK fell marginally short of OECD (average) employment growth of 1.7 per cent a year. Since the financial crisis, almost half of OECD countries (17/37) have had employment growth of above one per cent a year (Figure 7).
In terms of change in growth, OECD employment growth slowed to 1.1 per cent since the crisis compared to 1.3 per cent before; UK employment growth picked up to 1.2% compared to 1.0% before.
[1] UN (2019) ‘Report of the Special Rapporteur on extreme poverty and human rights on his visit to the United Kingdom of Great Britain and Northern Ireland’: undocs.org/A/HRC/41/39/Add.1
Figure 6: Employment growth
Across the fuller sample of OECD economies, the UK is one of fourteen countries with faster jobs growth since the crisis. These include four of the six countries with faster real wage growth since the crisis (Germany, Poland, Japan and Chile).
Conversely, eight of the ten countries with the most severe deteriorations in employment growth also had severe deteriorations in real pay growth (the exceptions being Canada and France). These comparisons categorically indicate that high jobs growth is not driven by low pay; likewise, low jobs growth is not driven by high pay.
Figure 7: Employment growth by country, annual average per cent
Austerity on the ground
The above charts are necessary for a macroeconomic perspective on the labour market, but fall far short of the impact at the coal face. While the focus of this paper is on the macroeconomic policy behind these choices, here we set out some brief facts about the human impact of austerity.
Just because UK outcomes are in line with many other economies does not detract from the unprecedented failure of wages. Most countries do not have long runs of figures readily available, but in the UK the decline is without precedent in 200 years.[1] While some point at improvements to the income distribution, this is largely the result of levelling down. Weekly wages have declined across the whole income distribution, except for gains in the bottom quintile thanks to the increased minimum wage. Over the latest two years, however, pay at the top end is rising rapidly.[2] The impact on disposable income has been moderated by benefits, but from 2017/18 welfare cuts have begun to hit hard those on the lowest incomes.[3]
The conditions at work have greatly deteriorated since the financial crisis. There are 3.7 million people in insecure work, and nearly two million (1.85m) self-employed people earn less than the minimum wage.[4] The latest numbers of workers employed through zero-hours contracts showed a rise of more than 100,000 since a year ago to 896,000.[5] As the United Nation’s special rapporteur has confirmed, for too many work is no longer a route out of poverty. Overall levels of poverty in the UK are little changed in 15 years, but the number of people in working households living in poverty in Britain has increased from 5 million to 8 million (Figure 8).
[2] ‘Pay for the top 1% rockets but working people still feel the squeeze’, Alex Collinson, TUC blog, 12 October 2019. www.tuc.org.uk/blogs/pay-top-1-rockets-working-people-still-feel-squeeze
[3] ‘Britain's broken politics: Tax cuts for the rich, frozen benefits for working families’, Anjum Klair, TUC blog, 1 April 2019. www.tuc.org.uk/blogs/britains-broken-politics-tax-cuts-rich-frozen-benefits-working-families.
[4] TUC (2019) ‘A stronger voice for workers: How collective bargaining can deliver a better deal at work’, September. www.tuc.org.uk/research-analysis/reports/stronger-voice-workers
[5] TUC (2019) ‘Jobs and pay at risk from no-deal Brexit’, 13 August. www.tuc.org.uk/news/jobs-and-pay-risk-no-deal-brexit-says-tuc
Figure 8: In work poverty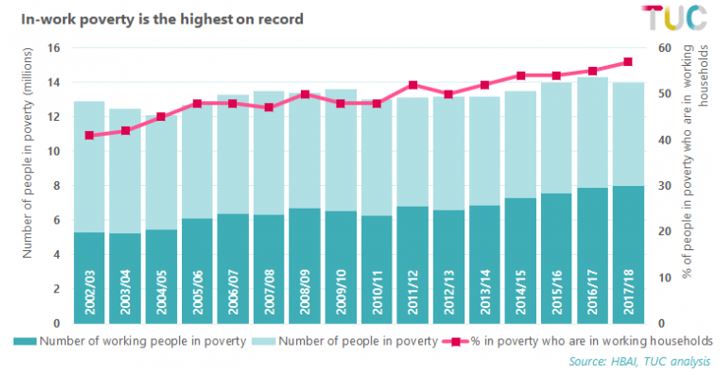
Inadequate incomes feed through to bottom line. Savings have been sustained at historic lows, and many households are increasingly having to resort to credit to get by. In the UK unsecured debt is at a record high, and the National Audit office report 8.3 million households struggling with debt.[1]
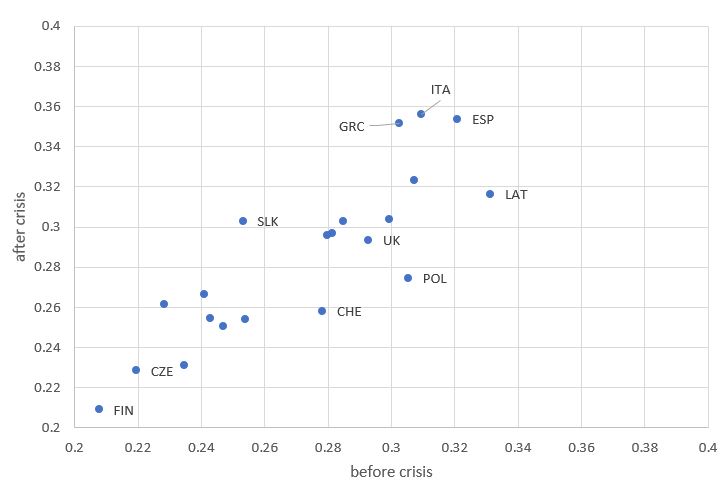
Nor is poverty exclusive to the UK. In a large majority of OECD countries (with relevant figures available), poverty has increased since the global financial crisis. Figure 9 shows a standard measure, with poverty rising in all countries to the left of the diagonal.[2]
[2] The ‘Poverty gap’ is based on equivalised post-tax and transfer incomes, and compares how far the incomes of the poor fall below a poverty line (here, 60% of median income). Before crisis corresponds to an average across 2004-2008 and after crisis to an average across 2009-2017; some averages are based on partial information across years.
Headlines
The contemporary version of ‘economy’ is ‘expansionary fiscal contraction’. The idea is rooted in the ideology or prejudice that the public sector operates against the private sector, so moving the public sector out of the way permits the private sector to flourish. The mechanism is usually portrayed as operating through the real interest rate, with high government borrowing leading to higher interest rates which constrain private sector activity because it is more expensive to borrow.
The prediction is categorical: reduced government expenditure growth will lead to higher private sector growth and at worse unchanged but likely higher GDP growth. The results of austerity are no less categorical, but in the reverse direction. In all countries where government expenditure growth was cut, GDP growth slowed. The only countries where GDP growth increased – Germany and Japan – were those where government expenditure growth was increased.
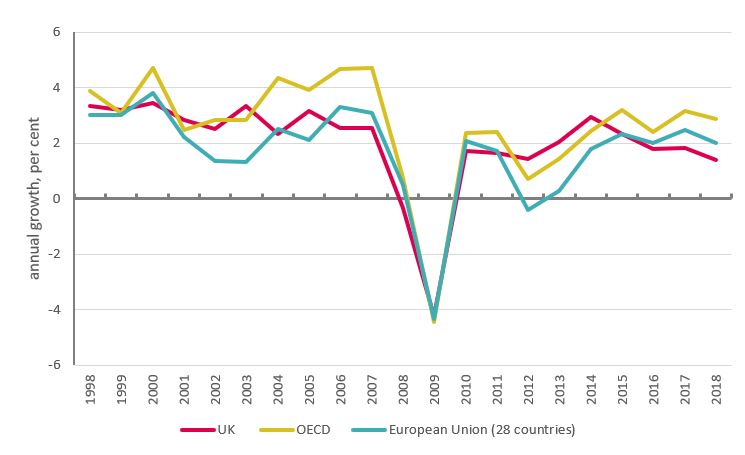
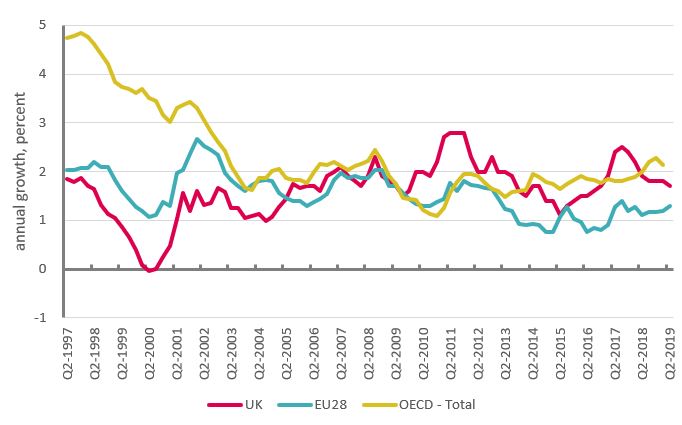
Figure 10 shows annual average growth for real GDP slowing from 3.7 per cent to 2.3 per cent, and corresponding reductions for the UK – from 2.9 to 1.9 - and euro-area – from 2.3 to 1.4. In nominal terms – as with wages – OECD GDP growth slowed by nearly half, from 7.7 per cent to 4.4 per cent.
Figure 10: Real GDP growth
Contributions to growth of the expenditure measure of GDP: UK
Though it is often treated otherwise and regarded as a truism, the claim that private sector expenditure will increase to compensate for cuts in government is a theoretical proposition that can be tested empirically. In the general case, changing the growth of government expenditure is likely to impact on economic growth overall.
Economic activity is normally understood as the result of the combined expenditures of the different sectors of the economy (i.e. government, household, business, overseas). The associated theoretical concept is demand, with aggregate demand the sum of the parts; in practice, demand is measured by the expenditure measure of GDP: GDP(E).
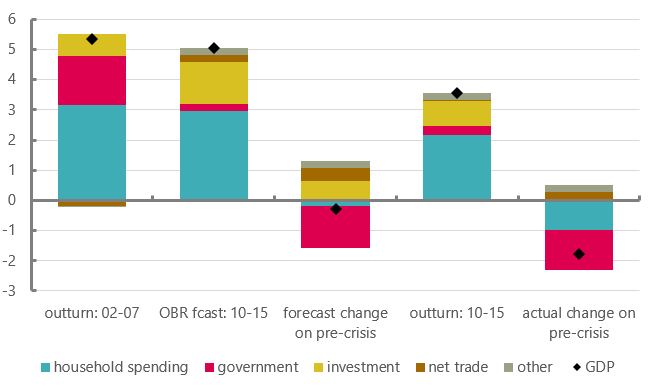
To assess the impact of austerity, the relevant measure is the growth of GDP(E) and the contributions of the various sectors to growth over time. The UK experience is best illustrated starting with the OBR’s original forecast for outcomes over the first parliament of austerity under the Coalition Government. Figure 11 shows annual average growth rates of GDP and the contributions to growth ahead of (2002-2007) and after (2010-2015) the financial crisis.
Regarding austerity economics as a truism, the OBR expected GDP growth over 2010 to 2015 to be little different to the years ahead of the financial crisis; while austerity meant the contribution of government spending to growth would be down to near zero, investment and trade were expected to compensate (columns 2 and 3). But this did not happen, and consumer demand also fell significantly short of expectations (columns 4 and 5). Overall, annual GDP growth slowed materially: (in nominal terms) to 3.5 per cent after the crisis compared to 5.3 per cent ahead of the crisis, a reduction of 1.8 ppts a year.
Figure 11: Expenditure measure of GDP growth, annual average percentage point contributions
Experience across the OECD
Figure 12 shows the reduction in GDP growth across all OECD countries, here using the most up-to-date figures through to 2018 (comparing pre-crisis from 1999-2007 with post-crisis from 2010-2018).
In all (32) countries where government spending growth was reduced, GDP growth was reduced. The only countries with increased GDP growth were Germany and Japan, where government expenditure growth increased. In Sweden, Israel and Chile government spending growth was marginally up but GDP growth was down.
On this basis, the UK decline ranks 7th out of 37 countries (in part because of higher inflation). Apart from Italy, the G7 economies (along with the EA aggregate) come in the top half of the ranking. Half of these countries have declines between 1 and 3 percentage points a year. For clarity, the figures are detailed in the annex, along with pre- and post-crisis growth rates.
The result is categorical, but says less about scale. The normal approach to analysing the effects of fiscal policy on the overall economy is with multipliers.[1]
The simplistic approach to multipliers is to compare the overall changes in (GDP) outcome with changes to government expenditure. Figure 12 suggests an unambiguous positive relationship: the higher the cuts in government expenditure growth, the higher the reduction in GDP growth.
In the case of the UK, the contribution of government expenditure was reduced by 1.3 percentage points a year; comparing with the 1.8 ppts reduction in GDP growth suggests a (negative) multiplier of 1.4 (= 1.8 /1.3). Taking an average across all countries leads to a multiplier of around 4.
But this calculation attributes all the change in economic outcomes to government expenditure, when other factors must be playing a part, not least the severity of the output decline in the first place and the ability and inclination of central banks to support activity.[2]
[1] See Progressive Economy Forum (2019, forthcoming) ‘From false multipliers to nonsense output gaps’.
[2] The sample is also heavily skewed, given the absence of any countries with material increases in government expenditure. Scientifically – let alone socially – more countries with increased spending would help increase the robustness of the results.
Figure 12: Expenditure contributions to change in GDP growth, percentage points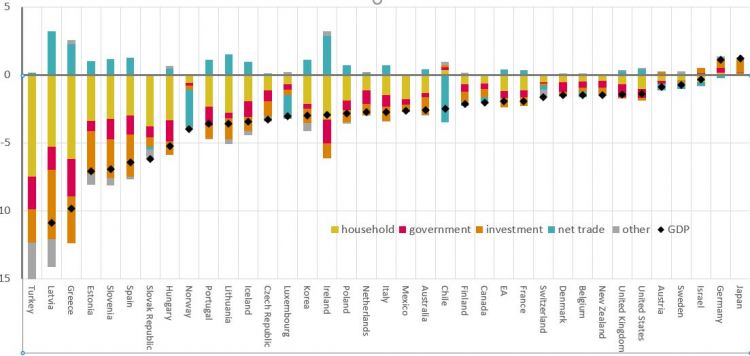
The elevated importance of trade
Structural reforms to promote competitiveness are key to achieving higher growth through more dynamic exports [1]
Under the original policy recommendations, countries were advised to aim for international competitiveness. More directly, with austerity reducing domestic demand, trade has become of even greater importance to output as a whole.
Figure 13, for the average across OECD countries, shows exports (blue) in many years from 2008 accounting for a far greater proportion of overall demand than normal (purple line on right scale). Since the crisis, exports have accounted for half (48.0%) of aggregate demand growth, compared to a third (34.7%) before the crisis (excluding 2008/2009).
The chart also shows how exports have been particularly important to economic revival: first, after the crisis (2010/11); second, after the most intense period of austerity (2014/15); and third, over the latest two years (17/18).[1]
[1] Note the chart is derived as the (unweighted) average experience across OECD counties. These therefore include goods and services that are exported and imported within the OECD (so-called intra-OECD trade). Moreover, imports and exports match quite closely: under ‘global value chains’ the production and distribution of goods and services is coordinated across more than one country, so that increased activity affects trade flows in both directions (these effects are measured by the OECD as ‘trade in value-added’/ TiVA - https://www.oecd.org/sti/ind/measuring-trade-in-value-added.htm).
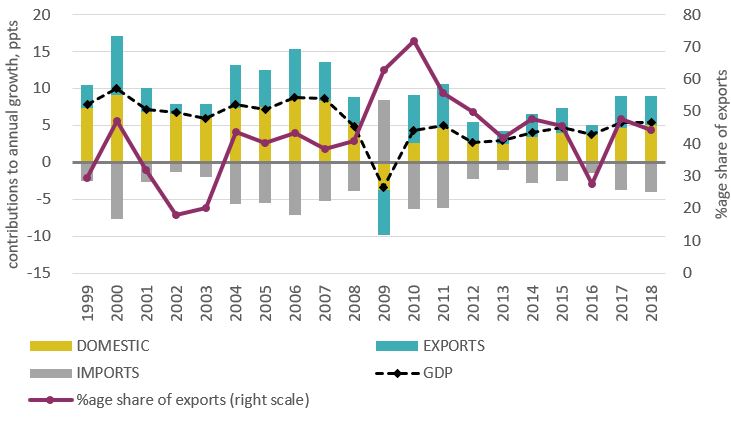
Figure 14 shows the (pre- to post- crisis) change in GDP growth, corresponding to Figure 12 above, with net trade expanded between exports and imports and the domestic demand categories combined.
For the majority of countries the reduction in domestic demand greatly outstrips the reduction in exports; NB Figure 13 showed exports tending to account for a third of growth ahead of the crisis.
Figure 14: Domestic and external contributions to change in GDP growth, percentage points
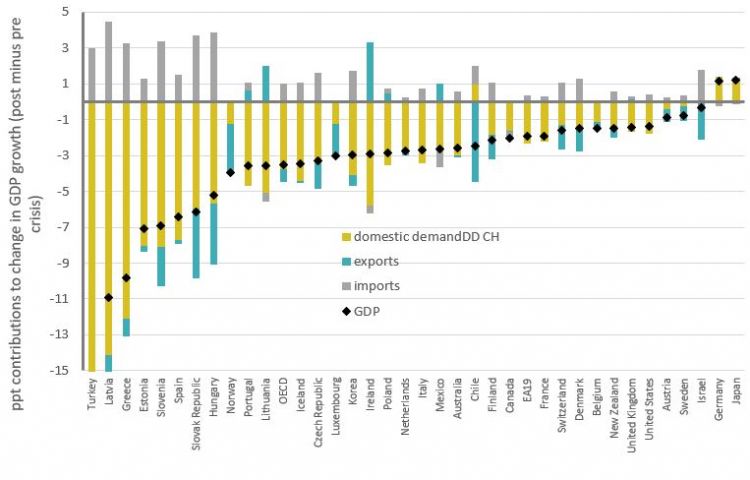
Figure 15 shows a country breakdown of exports as a share of final demand (i.e. domestic demand plus exports) growth before and after the crisis. For the great majority of countries, exports have become more important to GDP growth than ahead of the crisis. The accession countries have the highest increases, from already high levels.
Figure 15: Exports as a percentage share of final demand
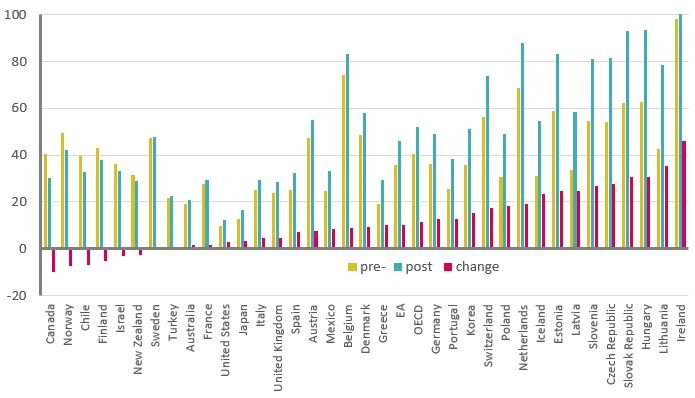
Trade growth is reduced in absolute terms, but has become significantly more important in relative terms, given the large reduction in domestic demand. The extent of this relative gain is perhaps surprising, and must result from increased competition and/or the reallocation of production within the OECD (involving winners and losers), the greater importance of global value chains (n. 14) and stronger demand from outside OECD countries.
The trend has likely been exacerbated by post-crisis policy. QE has supported investment flows from advanced to emerging economies (see section 8), and rapid growth in emerging economies has fostered increased trade with advanced economies.
Whether this is desirable must be debatable. While policy is now increasingly protectionist, over the past decade trade has become more not less important as domestic impetus has been contained.[1]
[1] And this is part of a longer-term trend. touchstoneblog.org.uk/2017/01/globalisations-strength-is-through-domestic-demand-thats-why-its-in-crisis/
Labour and capital share
On the basis of the demand approach to analysing the economy, labour market outcomes are a result of the weakness in the economy.
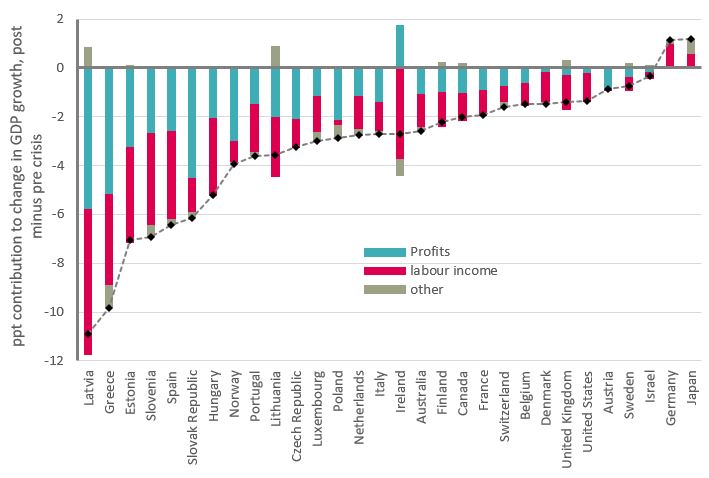
In broad terms, incomes accrue to business (or ‘capital’) as profits and to workers (‘labour’) as wages and jobs. In analytical terms, reduced expenditure growth must be matched by reduced income growth (as an accounting identity). In all OECD countries, the reduction is shared between both labour income and company profits. Overall, the adjustment is disproportionately towards labour – with Ireland an extreme outlier. Very broadly across these countries 2/3 of the adjustment is on labour. Notably, once more, Germany and Japan stand out with positive adjustments for labour income.
Figure 16: Change in GDP growth by income categories, percentage points
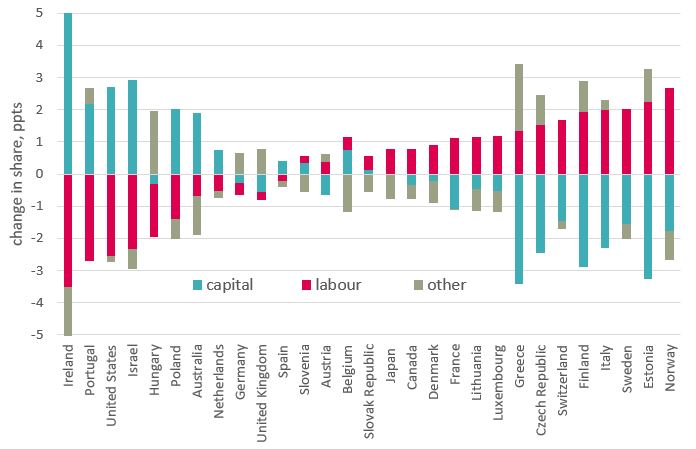
Trade unions are interested in the ‘labour share’ that captures labour income as a share of GDP. The actual change in labour share for individual countries depends on the level ahead of the crisis, and also the changes over the recession that are not included. Despite the long-standing attrition,[1] the labour share is generally still higher than the capital share so a larger adjustment on labour is partly to be expected. Figure 17 therefore directly shows respective changes to labour and capital since the crisis. On this basis a majority of countries have seen a moderate improvement in the labour share since the crisis, though any such gains generally fall far short of longer-term reductions.
[1] In 2015 the OECD and ILO outlined the long-run trend for of an estimated G20 labour share: “the average labour share for the 9 countries with data from the 1960s declines from a peak of more than 65 per cent to about 56 per cent in the most recent year”. www.oecd.org/g20/topics/employment-and-social-policy/The-Labour-Share-in-G20-Economies.pdf
Figure 17: Change in labour and profit share since crisis, percentage points
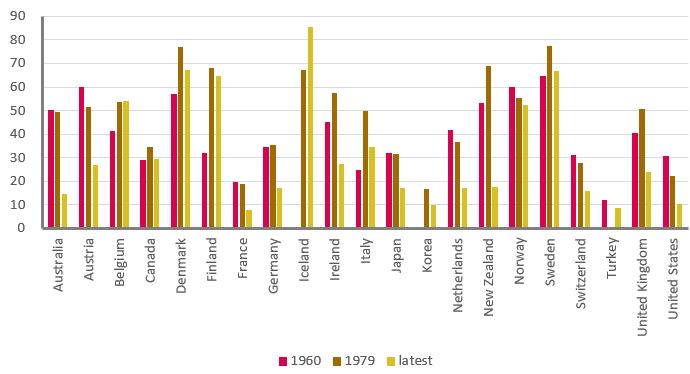
It is sometimes argued that trade unions are no longer relevant to labour market outcomes. Here several of the countries with the largest improved labour share are associated with stronger trade unions (see Figure 18) – most obviously the Scandinavian countries. Conversely union strength has been greatly undermined in a number of those with declines in the labour share (Australia, Hungary, UK and US). Plainly there are other factors in play, not least the vigour of the expansion in the A8 countries.
Figure 18: Trade union density, percentage of workforce
Labour market adjustment and productivity
The adjustments of most importance to analysis of post-crisis outcomes are those within the labour share.
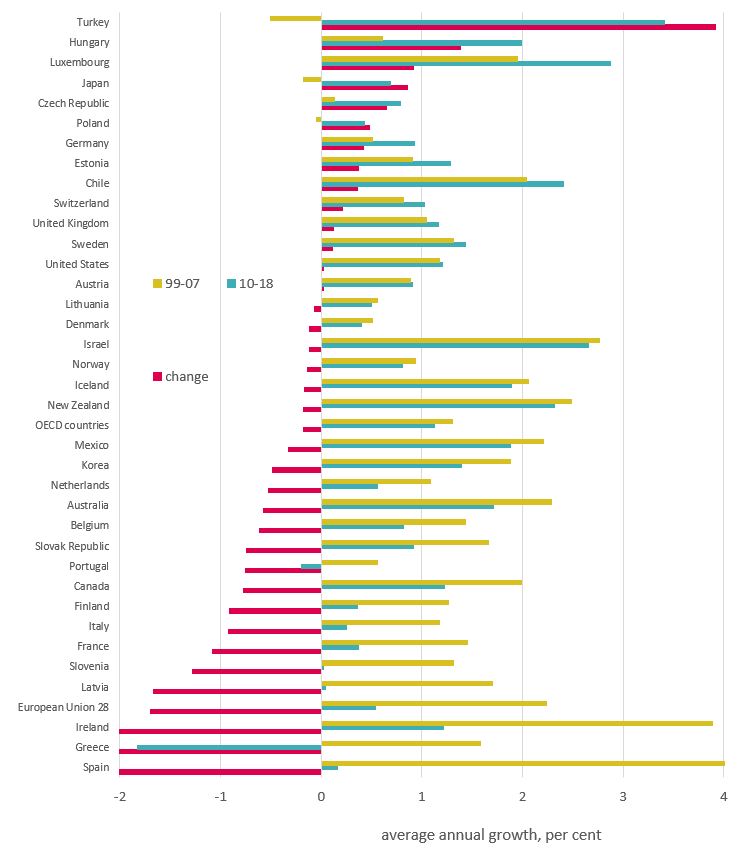
The wage and employment changes discussed in section 3 follow from the overall adjustment in labour income. Figure 19 shows first how the adjustment on labour income can be decomposed between jobs (yellow) and pay (grey).[1] Most countries (as in the ‘average’) have adjusted mostly on wage (grey) relative to employment (yellow). Figure 19 then shows this adjustment is a determining factor in ‘productivity’ outcome.
[1] The calculation is an approximation, based on adding jobs and wages growth (employers’ contributions to pensions are also ignored).
Figure 19: Labour adjustment and productivity, percentage growth
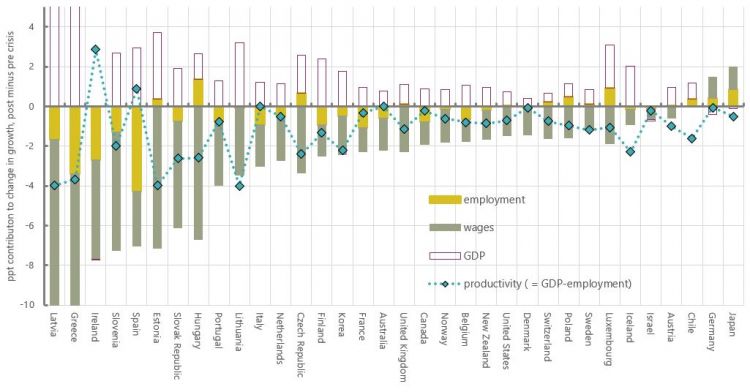
In mathematical terms, the simplest measure of labour productivity compares GDP with jobs. On the chart, employment change contributes to productivity with its sign reversed (a larger fall in employment means higher productivity) so GDP is also shown with its sign reversed (the purple outlined columns). The key point is that productivity outcomes (blue diamonds) are a function of how jobs and wages adjust in the context of reduced labour income.
So, in the case of the UK, with all the labour income adjustment on wages, reduced productivity growth is the result of comparing reduced GDP growth with slightly increased employment growth. As the chart shows, of other countries grouped close to the UK, the US, Switzerland, Poland and Sweden have operated in almost exactly the same way. Estonia, Hungary and Czech Republic are more extreme variants.
Germany and Japan are unique for both higher jobs and GDP growth, but jobs gains outstrip GDP gains and so the productivity change is negative (only marginally so for Germany).
There are productivity gains in only two countries, Ireland and Spain, but as a result of collapsed employment. Other countries achieving near-zero productivity change have done so with falling jobs broadly matching falling GDP (Italy, France, Australia, Canada, Denmark, Israel). For these countries, while nominal wage growth has still declined, the decline is proportionately lower as the flip side of the higher reduction in jobs growth.
The supply of the economy is normally important to overall economic outcomes, for example the robustness of the financial system, labour market conditions and the quality of national infrastructure. But over the austerity period ‘productivity’ outcomes are more a result of how the labour market has adjusted to lower aggregate demand. Productivity has been the residual of the wider process, of how economies have adjusted to degraded growth; it has not been the cause.
The manner of the labour market adjustment in different countries is of interest. Again the grouping of countries with the UK corresponds broadly to those with lower union density. From a more straightforwardly empirical viewpoint, those countries with relatively smaller labour income adjustments have tended to be wholly skewed to wages.
It is unlikely that productivity is a relevant metric under present conditions. Productivity is the way economies can achieve higher growth when labour is fully utilised; over the past decade economies have slowed while there has been spare capacity in the labour market.[1] Contrary to much commentary, the UK is not exceptional from the perspective of productivity. Regardless of longer-standing structural defects, in the current situation increasing aggregate demand is likely to improve productivity.
[1] When GDP is slowing, adjusting on wages undermines productivity; when GDP is expanding, adjusting on wages improves productivity.
Policymakers are only very gradually conceding this interpretation of the wage crisis.
To date, official policymakers including the OBR and Bank of England in the UK have not considered that weak demand might be causing low wages. Rather, the preoccupation has been whether occasionally higher wage growth indicates too strong demand. This view has very real implications. Not only is fiscal policy permanently set to austerity, but there is an ever-present threat of monetary policy tightening and further holding back growth and wages. This reversal is effected through near-exclusive focus on the supply side of the economy and the related idea of capacity.
The supply side of the economy
In most commentary, any failures of the economy are regarded as failures of the supply side (also known as structural factors). The idea of a ‘productivity puzzle’ reflects the difficulty of explaining productivity outcomes since the financial crisis. A vast literature addresses the potential role of for example poor capital stock, bad management, ‘zombie companies’ or poor skill levels in the workforce.[1] In spite of failing to resolve the puzzle, policy proceeds on the basis of the supply-side view.
Government action to improve outcomes is based on an industrial strategy and the newly convened Industrial Strategy Council. Plainly there is much wrong on the supply side of the economy: a financial system that fosters speculative excess rather than productive advance, an absence of industrial planning, limited regional and sectoral policies, attacks on trade unions and inadequate support for upskilling. Trade unions have long supported the development of industrial strategies.
But these defects long predate the global financial crisis and austerity, and do not explain what changed after 2008. As above, in the context of the weak economic growth experienced by the UK and other countries since the global financial crisis, productivity statistics show effect not cause.
The output–gap
The exclusively supply-side analysis is a barrier to policy change going forward. Under the basic (and long-standing) framework for monetary and fiscal policy, the economy is understood in terms of both demand and supply conditions. Policymakers (in the UK, the BoE and OBR) project trajectories for both supply and demand growth into the future; the trajectory for supply is known as ‘potential’ and the difference with demand is the ‘output gap’.
The output gap is understood as a measure of capacity, i.e. the ability of an economy to grow without causing inflation. A zero or positive output–gap indicates there is no spare capacity. In practice policymakers operate according to their assessment of the contemporaneous output gap. If demand is sustained below potential, expansionary policy will improve outcomes; when demand is sustained above potential, contractionary policy is necessary to avoid inflation. The charts below are a stylised representation of the OBR projection over the first five years of austerity, and their revised view five years later.
[1] E.g. ‘Four theories to explain the UK’s productivity woes’, Gemma Tetlow, Financial Times, 23 October 2017: www.ft.com/content/b6513260-b5b2-11e7-a398-73d59db9e399. In his Spending Review 2019 speech Sajid David made the usual appeal: “And we need to raise our productivity – the amount that’s produced every hour worked. That isn’t just some technical term. Slower productivity means lower wages and uneven growth across the country”.
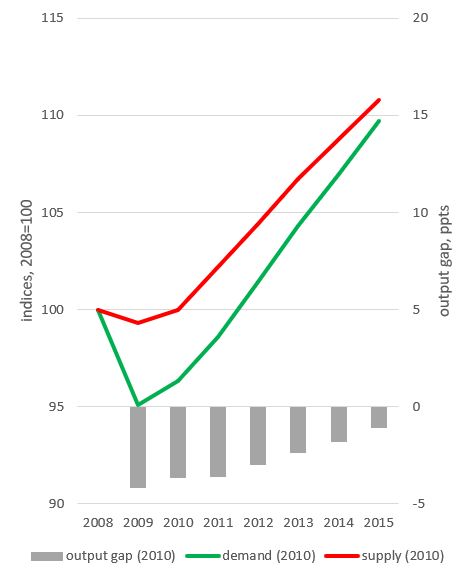
Figure 20b: OBR changed view five years later
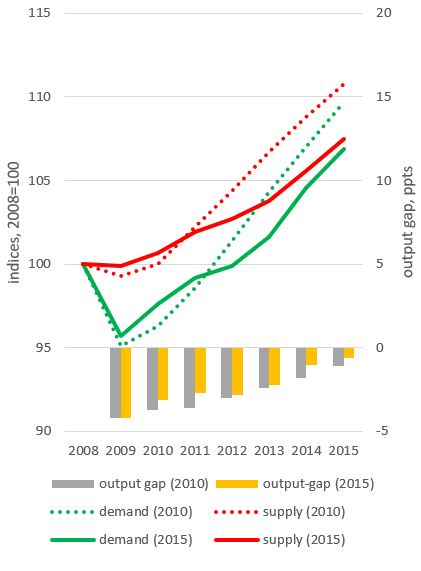
Over the first austerity parliament from May 2010 to May 2015, the OBR expected rising demand to steadily to close the gap with potential supply (Figure 20a). In reality (measured at the start of the new parliament in 2015) demand growth came in significantly lower than expected; and the OBR simply revised potential downwards to match. This follows the supply-side interpretation of productivity outcomes. In fact, the less negative output gap indicates that supply was revised by even more than the demand shortfall. Under the demand view, there is no reason to change the previous view of supply, and instead the output gap should be larger – i.e. more negative.
Under the demand view, the government should act to provide additional support to the economy. Under the supply view, any additional support will lead to inflation and so government expenditure cannot be further expanded.
For the past five years or so, both the Bank of England and OBR have considered the output gap effectively closed and the economy operating at capacity. This assessment is common to the majority of countries, see for example the latest OECD assessment of advanced economies for 2019 (Figure 21). The overall OECD output gap is marginally negative gap at -0.5; two thirds of countries are considered to have gaps close to or above zero.
Figure 21: Estimated output gaps in 2019, percentage of GDP
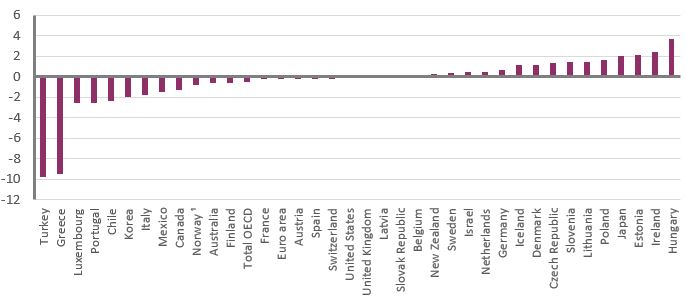
Even though the UK government claims that austerity is over, on this view there is no capacity for any substantial increase in the level of government expenditure without causing inflation.
There is now a wider backlash against the way output gaps have been deployed by policymakers, not least in the context of the tensions between the EU and Italy on fiscal policy. The historian Adam Tooze goes as far as arguing: “output gap estimates, in short, are politics pursued by the technical means of economics”.[1] He exposes how basing projections of potential on averaging historic experience has “truly perverse effects”. Over the past decade policymakers have used economics to affirm and re-enforce austerity, rather than assess impartially whether the approach has been wrong. Austerity economics is political.
The natural rate of unemployment
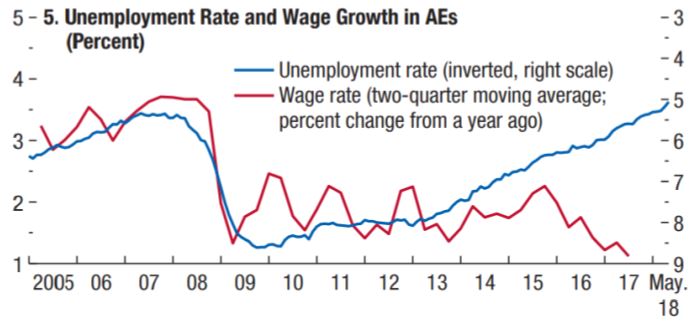
The other perspective on capacity is unemployment. According to the theory of the non-inflationary rate of unemployment (‘NAIRU’), when unemployment falls below a certain threshold wage inflation and then price inflation will be triggered.
But the present situation is characterised by the reverse process: employment gains and equivalently unemployment falls are occurring alongside wage declines. The IMF (2018 - below) show this is the norm across advanced economies: unemployment has been steadily falling since 2013, but wage growth had been shrinking since 2015.
[1] ‘Output gap nonsense’, 30 April 2019. www.socialeurope.eu/output-gap-nonsense
Outcomes have been opposed to the theory of the NAIRU. As a result, policymakers are having repeatedly to reassess the natural rate of unemployment. In remarks around a year ago, Andy Haldane (chief economist at the Bank of England) observed “Over recent years, the Bank has revised down its estimate of the NAIRU in the UK, by just under a percentage point, to around 4 ¼%”.[1] Others make the point that the increased levels of under-employment mean natural rates must be greatly lower.[2] But the logic that permits the natural rate to be a moveable feast must therefore set no necessary lower bound to the natural rate, not least because unemployment has been as low as 1 per cent in the past. More generally, the idea of a natural rate of unemployment is obviously problematic for trade unions; others are now catching up. As Matthew Klein argued in the Financial Times: “in addition to being morally odious, the theory is empirically unsupportable and is increasingly questioned by a younger generation of central bankers”.[3]
Inflation and supply capacity
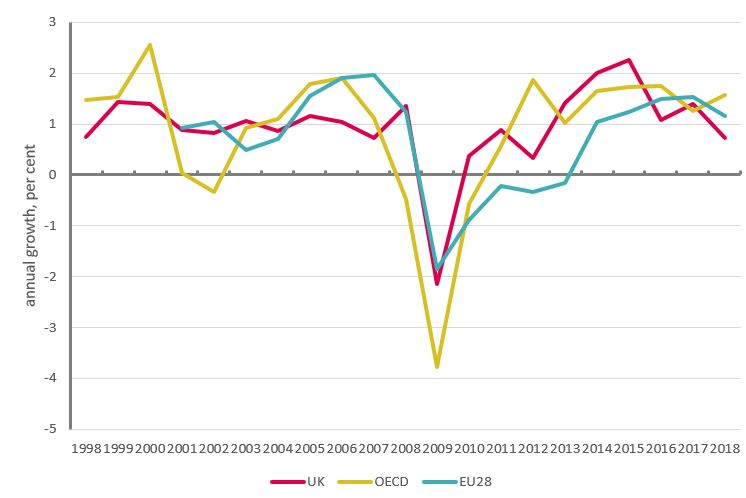
Under present conditions the only possible justification for assuming supply as the key factor would be the actual manifestation of inflation. But as Figure 22 shows, core inflation (excluding energy and food) has been dormant across all advanced economies for a decade and a half. The UK performance has diverged, albeit not greatly, mainly as a result of sterling devaluations and also changes to VAT. Fundamentally the position is consistent with demand – not supply – weakness.
[1] www.bankofengland.co.uk/speech/2018/andy-haldane-advisory-conciliation-and-arbitration-service-future-of-work-conference. Martin Beck at Oxford Economics (‘Next PM could shift policy gears to spur the economy’, 10 June 2019) points out that in 2013 the Bank thought the NAIRU was 6½ per cent.
[2] ‘Underemployment in the US and Europe’, David Bell, David Blanchflower, VOXEU, 24 September 2018, https://voxeu.org/article/underemployment-us-and-europe
[3] ‘NAIRU: not just bad economics, now also bad politics’, Matthew Klein, Financial Times Alphaville, 24 January 2018. ftalphaville.ft.com/2018/01/24/2198028/nairu-not-just-bad-economics-now-also-bad-politics/
Figure 22: ‘Core’ inflation, per cent
The view that the economy is at capacity not only constrains government expenditure, but also means periodic attempts to withdraw monetary stimulus. Governor Carney acknowledged earlier this year that central banks are torn between a ‘business’ and ‘financial’ view of the world.[1] At a global level, efforts to tighten policy (increase rates and withdraw QE) follow according to preconceived ideas of real capacity. The repeated abandoning of these efforts indicates the dominance of ‘financial’ constraints, more specifically constraints arising from high levels of indebtedness. At the time of writing (summer 2019), central banks have shelved 2018 plans to tighten monetary policy and are set for an increasingly expansionary policy, following collapsing asset markets and signs of fragility in the global economy.
The importance to crisis of debt inflation rather than (or as well as) price inflation is now widely recognised. The Bank of England observe “Countries that underwent sharp credit booms have often experienced a crisis”.[2] In 2008 this build-up of debt – with most emphasising mortgage debt – caused the global financial system to implode and led to the most severe global recession since the great depression in the 1930s. Since the crisis the instigation of ‘macroprudential regulation’ has been aimed at containing future financial excess.
But these strategies have not prevented ongoing increases to private and public debt at the global level. In their 2018 assessment of the global economy, the IMF observed:
Compared to the previous peak in 2009, global debt is now 12 percent of GDP higher. That is, except for a short hiatus, no deleveraging has taken place at the global level since the onset of the GFC.[3]
Compared with 10 years ago, many … economies have higher levels of corporate and sovereign debt, leaving them more vulnerable. With geopolitical tensions also relevant in several regions, we judge that, even for the near future, the possibility of unpleasant surprises outweighs the likelihood of unforeseen good news.[4]
[1] ‘The Global Outlook’, 12 February 2019. www.bankofengland.co.uk/speech/2019/mark-carney-speech
[2] Bank of England (2018) Financial Stability Report, June (Chart A.28 p. 22).
[3] Samba Mbaye, Marialuz Moreno Badia, and Kyungla Chae (2018) ‘Global Debt Database: Methodology and Sources’ IMF Working Paper, May. www.imf.org/en/Publications/WP/Issues/2018/05/14/Global-Debt-Database-Methodology-and-Sources-45838
[4] IMF, op. cit. p. xv.
The Bank of England’s routine overview of financial stability emphasises UK non-financial corporate debt still elevated relative to historical standards, material risks from global debt vulnerabilities, US corporate debt now above pre-crisis levels (in part reflecting the growth of leveraged lending), falling commercial real estate prices, and vulnerabilities in open-ended investment funds.[1] Others warn that private debts have not been resolved but are merely hidden from sight. [2] With the regulatory authorities’ main focus on repairing the banking system, there are also concerns that exposures to debt have shifted to pension and other investment funds. The OECD warn of risks shifting to “more lightly regulated non-bank financial institutions”.[3]
At a global level, post-crisis policy appears to have exacerbated rather than resolved financial factors/imbalances.
First, austerity has not resolved the public debt. While policy was motivated by the (now discredited) threshold of 90% of GDP, on the IMF aggregate for advanced economies, a 70% debt ratio ahead of the crisis has given way to a ratio of above 100% in every year since 2011. No material fall is expected into the future.[4]
Second, monetary policy is supporting a failed fiscal strategy. In a June 2017 speech, Governor Carney illustrated how QE was integral to the present fiscal policy setting.[5] Over 2013-2017 new government bond issuance in G4 countries (UK, Japan, US and Europe) has matched almost exactly central bank asset purchases at around £1.5 trillion a year.[6] In a roundabout way, these purchases of government bonds means central banks are supporting the failure of austerity policies to reduce high levels and hence issuance of public debt.
Third is the consequent feedback to private debt. Under QE, central banks exchange financial institutions’ holdings of government bonds for deposits; these deposits are then re-invested in the UK private sector and/or in the private and public sectors of other countries.[7] In their 2016 assessment, ‘QE: the story so far’, the Bank of England chief economist Andy Haldane and others observed a “powerful international portfolio rebalancing channel”.[8]
As the headline figures for growth and employment show, the consequent flows of international capital are likely to have fostered very vigorous expansion in a number of countries. But these expansions are vulnerable to any reversal of such flows. In the wake of last year’s financial turbulence, some countries are now in serious economic distress. The largest such economies in near or outright recession are Turkey, Brazil, South Africa and Argentina.
Repeated backtracking on intended policy tightening, and virtually continuous quantitative easing (‘QE∞’) at a global level, suggest that the global economy is utterly reliant on monetary ease.
The global economy is not constrained by capacity and inflationary pressures; it is constrained by the need for finance channels to remain open in the high private debt environment. This is in fact the reverse of the inflationary situation. Corporate (and unsecured household) debt on a global level is the result of production going beyond incomes and so beyond purchasing power. The ongoing real-world consequence is an inability to raise prices; this may also be a factor in the dumping of excess production on western markets and consequent trade and geo-political tensions (perhaps as effect more than cause).
There is no danger of inflationary excess, the danger is of financial relations unravelling as they did in the great recession or worst. While post-crisis policy was allegedly aimed at a ‘new model’, fiscal restraint/monetary ease has simply restored a new variant of the pre-crash economy.
While this failure is deep rooted, it is not an inevitable condition. Faced with the same situation in the 1930s, a very different policy approach would gradually and very painfully emerge.
[1] Financial Stability Report, July 2019.
[2] Yannis Varoufakis in the Guardian: ‘ten years after the crash, have the lessons of Lehman been learned’, 18 September 2018. www.theguardian.com/commentisfree/2018/sep/14/the-panel-lehman-brothers-ten-year-anniversary-financial-crash
[3] OECD Economic Outlook, May 2019.
[4] IMF, Historical public debt database. www.imf.org/external/datamapper/datasets/DEBT/1
[5] Mark Carney, [De]Globalisation and inflation, speech, 18 September 2017
[6] And this is despite the main QE action shifting between the Fed., ECD and BoJ (section 3 above). Carney also discussed how Federal Reserve plans to reduce their holdings of government debt will start to put upwards pressure on interest rates. Over 2018 these plans became a reality as did the rise in global interest rates. But, exemplifying the contradictions in the present policy mix, the same reality triggered stress in financial markets. Interest rates are now rapidly falling.
[7] Michael McLeay, Amar Radia and Ryland Thomas (2014) ‘Money creation in the modern economy’ Bank of England Quarterly Bulletin, 2014 Q1
The mantra after the financial crisis was that the public – households and government – had been living beyond their means. The reality is that the economy is operating beyond the means of workers. Rather than reduce the means of the economy, the solution is to increase the means of workers. The situation, and the associated hardships, successes and setbacks, rationalise two centuries of trade union policy.
The remedies operate in two directions, first by securing trade union rights, widespread use of collective bargaining and decent conditions at work to help drive up pay and conditions. This report is concerned with macroeconomic policies that operate in the second direction. In the present context, several issues need to be addressed.
A changed perspective on the economy
As we set out above, at present action is contained by the overriding judgement that we are living beyond our means. Beyond a little flexibility in the early years of the crisis, these have translated to a view that for the past five years the economy has been operating at capacity. Alternatively, the output gap is judged to be closed. This view is doubly wrong. Shortfalls in outcomes under austerity have been wrongly attributed solely to the supply-side of the economy. This is compounded by wrong judgements about the likely size of the output gap at start of the crisis.
MPC members have recently recognised uncertainties in this area. Silvana Tenreyro points at low core inflation for services as a potential indicator of a negative output gap.[1] In a discussion of David Blanchflower’s new book, Gertjan Vlieghe addressed the relation between demand and productivity:
“I thought he would perhaps argue that, if only there was more demand stimulus, higher productivity growth might return, i.e. that some part of the lost productivity is cyclical and reflects lower intensity of factor utilisation, not structural developments. I would have some sympathy with that idea.” [2]
The problem is confounded by underestimates of multiplier effects. Therefore a more realistic estimate of the behaviour of the output gap since the crisis will require a more realistic estimate of multipliers. The IMF are among the sources cited by the OBR for their multiplier estimates. Yet the OBR did not react when the IMF very quickly reviewed their position given the experience of austerity across countries. The IMF’s revised estimate of between 0.9 and 1.7 provides a sound way forward.
The same goes for the NAIRU. Always a contentious idea for trade unions, doubts about relevance are now widespread. Above all, Jay Powell, the Chairman of the Federal Reserve, has acknowledged “the relationship between the slack in the economy or unemployment and inflation was a strong one 50 years ago … and has gone away”.[3] In practice the NAIRU has been reduced retrospectively, in the light of benign inflation outcomes. A more positive approach would be to operate policy according to a lower NAIRU, perhaps shifting down one percentage point at a time.
Overall policymakers have throughout mistaken a situation of excess supply with one of excess demand. As Figure 22 sows, inflation has corresponded to the former situation throughout. The present trajectory of ‘potential’ is wrongheaded and effectively imposes stagnation. At a global level, the likely danger is of deflation not inflation.
Spending: current and capital
Given a wider output gap, policy needs to operate on demand.
Operating on demand will strengthen economic activity, current expenditures on public sector wages, public services and welfare are not only desperately needed but an economic necessity. As Vleighe speculated, they will result in higher growth, increased employment and reduced underemployment, wages and productivity.
But plainly there is a wider need to begin to reconstruct the UK economy, to revitalise the manufacturing industry, address severe regional imbalances and address other social priories – not least climate change. As a starting point public investment should be raised to the OECD average of 3.5 per cent of GDP. Investment spending is doubly advantaged as it operates on both demand and supply, but current spending – especially a fully-funded pay increase – is easier to get up and running as purchasing power catches up with production. Wage dynamics over the past decade are a symptom of austerity; expansionary fiscal policy will mean expanding wages across the economy and a virtuous cycle of increased expenditure and stronger growth.
Fiscal constraint
The public debate on austerity has been gravely misleading. The past decade has showed cutting spending to be counterproductive: the private sector was not ‘crowded out’ by government spending. The correct approach is an expansion of public spending to ‘crowd in’ private sector spending.
Likewise, austerity did not improve the public sector debt. Slower than expected GDP growth meant weaker government revenues[4] and greatly slower than planned deficit reduction, taking roughly ten rather than five years.[5] Reduced pace deficit reduction has not been adequate to reduce debt. Before the Coalition Government’s austerity policies, the debt ratio was expected to peak at 70 per cent of GDP in 2013-14; the ratio has now (probably) peaked in 2018-19 at 86.5 per cent of GDP; it is not expected to fall to 70 per cent of GDP at any point in the future. and so higher public debt.
Increasing government expenditure will strengthen the economy and the consequent gains in revenues and reductions in welfare spending will improve the public sector finances and public debt ratio.
Financing of spending
Aspects of the fiscal policy debate have become bogged down in calls for the central banks to aim money creation more directly at good causes, for example ‘green quantitative easing’.[6] Carney’s (2017) analysis shows just how important this mechanism already is. But the real point is that government expenditure should be self-financing through leading to increased economic growth. In 1932 the Danish economist Jens Warming observed “If a bank promises credit for an investment it really disposes of something belonging to the future: the coming saving”.[7] Keynes called for ‘loan-financed public works expenditures’, with the approach to loan financing a function of his wider initiatives around debt management.[8] But equally he was distancing himself from raising taxes to fund public services as putting the cart before the horse. Tax revenues should rise automatically as GDP expands; the repositioning of the tax system is a separate matter.
The constraints on action by government in post-crisis economies are self-inflicted. The logic needs to be turned upside down. A focus directly on jobs and the quality of work will make economic conditions right.
Plainly any such initiatives should not stand alone, but be part of wider (and related) strategies for industry, energy, regions, skills and the environment. Finally, as part of broader action to support private productive activity, there is a need for a more deliberate action on investment banks, reform of the domestic banking system as well as wider issues related to globalised finance. These are outside the scope of the present discussion.[9]
[1] ‘The elusive supply potential: monetary policy in times of uncertainty’, 7 March 2019.
[2] ‘Not Working - Where Have All the Good Jobs Gone?’ - David Blanchflower in conversation about his latest book with Dr Gertjan Vlieghe. www.niesr.ac.uk/events/not-working-where-have-all-good-jobs-gone-david-blanchflower-conversation-about-his-latest. In the same discussion John Llewelyn (consultant) argued productivity might be endogenous rather than exogenous, and Jagjit Chada (director of NIESR) spoke of wages adjusting in respect of a given total amount of demand.
[3] ‘Powell seeks a cure for the ‘disease’ of low inflation’, Financial Times, 22 July 2019. www.ft.com/content/e2ff8c4e-aa2f-11e9-984c-fac8325aaa04
[4] For example the OBR showed a shortfall of £85bn for financial year 2015-16 (Forecast evaluation report, October 2016).
[5] See ‘TUC Budget Statement: Undoing the Damage’. November 2018.
[6] ‘Green quantitative easing: paying for the economy we need’, Colin Hines and Richard Murphy. www.financeforthefuture.com/GreenQuEasing.pdf
[7] Jens Warming (1932) ‘International Difficulties Arising Out of the Financing of Public Works During Depression’, Economic Journal, Vol. 42, No. 166, Jun., pp. 211-224.
[8] These were aimed at ensuring interest rates did not rise; fundamental to this was allowing the public (and markets) to choose how to borrow rather than the Treasury dictating preferred instruments. The relevant procedures were set out in a 1945 Treasury Report of the National Debt Enquiry; one such process was the introduction of Treasury deposit receipts which obliged retail banks to lend directly to government. See Tily (2010) Keynes Betrayed, Basingstoke Palgrave Macmillan, Chapter 7 and annex.
[9] However, see: GFC Economics, ‘Financing Investment – Final Report’:
labour.org.uk/wp-content/uploads/2018/06/Financing-investment-final-report-combined.pdf;
and Christine Berry and Laurie MacFarlane, ‘A new public banking ecosystem’:
labour.org.uk/wp-content/uploads/2019/03/Building-a-new-public-banking-ecosystem.pdf
Frances O’Grady (2016) ‘No Worker Left Behind’ IMF FINANCE & DEVELOPMENT, December 2016, Vol. 53, No. 4. www.imf.org/external/pubs/ft/fandd/2016/12/ogrady.htm
Muscles aching to work, minds aching to create - this is [hu]man.
Behind output gaps, natural rates and relentless cuts, is a wider futility that nothing can be done. Society must simply learn to live with degraded conditions. On this thinking the promise to end austerity is empty. For the moment at least households are relieved of the threat of interest rate rises. But instead the Financial Policy Committee of the Bank of England are “concerned by the rapid growth of leveraged lending, including to UK businesses” and warn “Risks to the UK from global vulnerabilities remain material”.[1] The global financial crisis may have been contained; it has not been resolved.
John Steinbeck’s career was fostered by the Federal Writers’ Project, a New Deal initiative. Roosevelt threw everything he possibly could at the Great Depression. In parallel his ‘Wagner Acts’ greatly strengthened the role of trade unions. Even UK government spending grew rapidly from 1934, as austerity policies were relatively quickly dismissed. War too makes it obvious that an economy – or rather the workforce – can support whatever is asked of it.
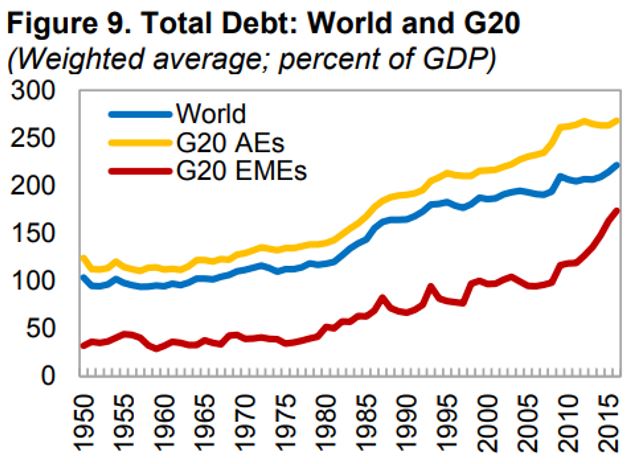
Under Clement Attlee, the first majority Labour government in British history inherited post-war debt of 250% of GDP, yet created the NHS, provided education for all, built “homes for heroes”, strengthened the welfare state and nationalised several industries. The economy began to grow with unprecedented vigour, the deficit moved into surplus and the public debt fell. Similar preconceived notions of capacity were proven meaningless, and private debt was benign for decades (as on the IMF chart above).
The Trades Union movement had been instrumental in the reconstruction of the Labour Party over the 1930s. The repeal in 1946 of the much-hated Trade Disputes and Trade Union Act of 1927 marked a new place for unions in society and the economy. To varying degrees, there were similar developments across the globe, supported by the Bretton Woods Institutions established after the war, under Keynes’s original initiative. “The result, in the third quarter of the 20th century, was economic growth in the industrialized countries at a pace never seen before”.[2] Upturning this approach has upended outcomes and led to the most insecure and frightening economic and political conditions since the great depression.
The experience tells us that outcomes are better when unions are strong and countries cooperate towards shared goals of full employment and decent social provision. A renewed New Deal for Workers is long overdue.
[1] Financial Policy Committee Statement from its policy meeting, 3 October 2018.
Stay Updated
Want to hear about our latest news and blogs?
Sign up now to get it straight to your inbox