Lessons from a decade of failed austerity
Labour and capital share
On the basis of the demand approach to analysing the economy, labour market outcomes are a result of the weakness in the economy.
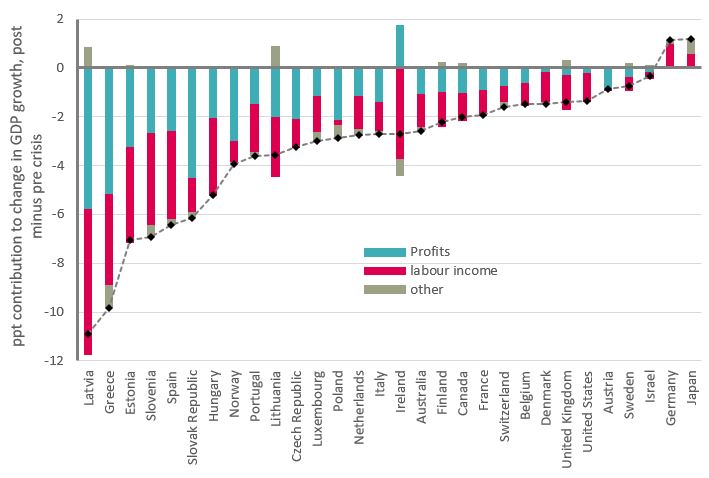
In broad terms, incomes accrue to business (or ‘capital’) as profits and to workers (‘labour’) as wages and jobs. In analytical terms, reduced expenditure growth must be matched by reduced income growth (as an accounting identity). In all OECD countries, the reduction is shared between both labour income and company profits. Overall, the adjustment is disproportionately towards labour – with Ireland an extreme outlier. Very broadly across these countries 2/3 of the adjustment is on labour. Notably, once more, Germany and Japan stand out with positive adjustments for labour income.
Figure 16: Change in GDP growth by income categories, percentage points
Trade unions are interested in the ‘labour share’ that captures labour income as a share of GDP. The actual change in labour share for individual countries depends on the level ahead of the crisis, and also the changes over the recession that are not included. Despite the long-standing attrition,[1] the labour share is generally still higher than the capital share so a larger adjustment on labour is partly to be expected. Figure 17 therefore directly shows respective changes to labour and capital since the crisis. On this basis a majority of countries have seen a moderate improvement in the labour share since the crisis, though any such gains generally fall far short of longer-term reductions.
[1] In 2015 the OECD and ILO outlined the long-run trend for of an estimated G20 labour share: “the average labour share for the 9 countries with data from the 1960s declines from a peak of more than 65 per cent to about 56 per cent in the most recent year”. www.oecd.org/g20/topics/employment-and-social-policy/The-Labour-Share-in-G20-Economies.pdf
Figure 17: Change in labour and profit share since crisis, percentage points
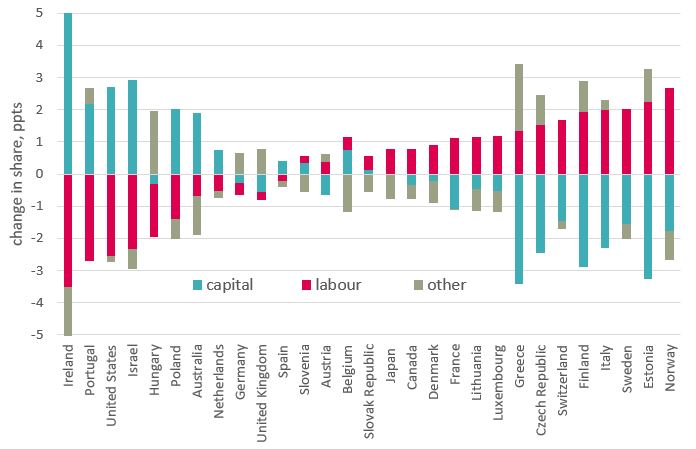
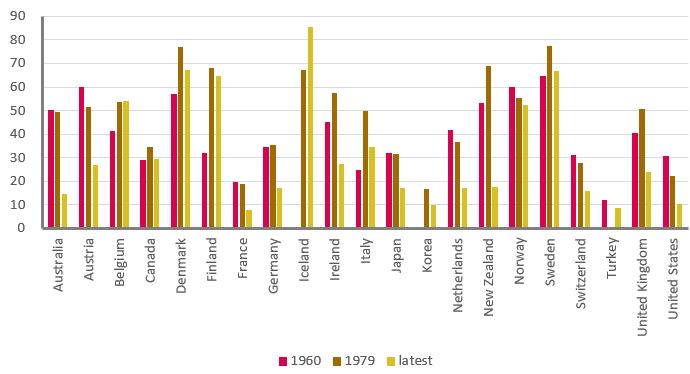
It is sometimes argued that trade unions are no longer relevant to labour market outcomes. Here several of the countries with the largest improved labour share are associated with stronger trade unions (see Figure 18) – most obviously the Scandinavian countries. Conversely union strength has been greatly undermined in a number of those with declines in the labour share (Australia, Hungary, UK and US). Plainly there are other factors in play, not least the vigour of the expansion in the A8 countries.
Figure 18: Trade union density, percentage of workforce
Labour market adjustment and productivity
The adjustments of most importance to analysis of post-crisis outcomes are those within the labour share.
The wage and employment changes discussed in section 3 follow from the overall adjustment in labour income. Figure 19 shows first how the adjustment on labour income can be decomposed between jobs (yellow) and pay (grey).[1] Most countries (as in the ‘average’) have adjusted mostly on wage (grey) relative to employment (yellow). Figure 19 then shows this adjustment is a determining factor in ‘productivity’ outcome.
[1] The calculation is an approximation, based on adding jobs and wages growth (employers’ contributions to pensions are also ignored).
Figure 19: Labour adjustment and productivity, percentage growth
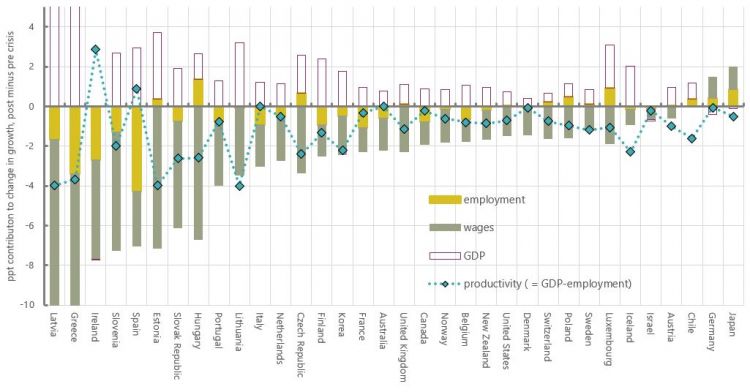
In mathematical terms, the simplest measure of labour productivity compares GDP with jobs. On the chart, employment change contributes to productivity with its sign reversed (a larger fall in employment means higher productivity) so GDP is also shown with its sign reversed (the purple outlined columns). The key point is that productivity outcomes (blue diamonds) are a function of how jobs and wages adjust in the context of reduced labour income.
So, in the case of the UK, with all the labour income adjustment on wages, reduced productivity growth is the result of comparing reduced GDP growth with slightly increased employment growth. As the chart shows, of other countries grouped close to the UK, the US, Switzerland, Poland and Sweden have operated in almost exactly the same way. Estonia, Hungary and Czech Republic are more extreme variants.
Germany and Japan are unique for both higher jobs and GDP growth, but jobs gains outstrip GDP gains and so the productivity change is negative (only marginally so for Germany).
There are productivity gains in only two countries, Ireland and Spain, but as a result of collapsed employment. Other countries achieving near-zero productivity change have done so with falling jobs broadly matching falling GDP (Italy, France, Australia, Canada, Denmark, Israel). For these countries, while nominal wage growth has still declined, the decline is proportionately lower as the flip side of the higher reduction in jobs growth.
The supply of the economy is normally important to overall economic outcomes, for example the robustness of the financial system, labour market conditions and the quality of national infrastructure. But over the austerity period ‘productivity’ outcomes are more a result of how the labour market has adjusted to lower aggregate demand. Productivity has been the residual of the wider process, of how economies have adjusted to degraded growth; it has not been the cause.
The manner of the labour market adjustment in different countries is of interest. Again the grouping of countries with the UK corresponds broadly to those with lower union density. From a more straightforwardly empirical viewpoint, those countries with relatively smaller labour income adjustments have tended to be wholly skewed to wages.
It is unlikely that productivity is a relevant metric under present conditions. Productivity is the way economies can achieve higher growth when labour is fully utilised; over the past decade economies have slowed while there has been spare capacity in the labour market.[1] Contrary to much commentary, the UK is not exceptional from the perspective of productivity. Regardless of longer-standing structural defects, in the current situation increasing aggregate demand is likely to improve productivity.
[1] When GDP is slowing, adjusting on wages undermines productivity; when GDP is expanding, adjusting on wages improves productivity.
Stay Updated
Want to hear about our latest news and blogs?
Sign up now to get it straight to your inbox