Lessons from a decade of failed austerity
Headlines
The contemporary version of ‘economy’ is ‘expansionary fiscal contraction’. The idea is rooted in the ideology or prejudice that the public sector operates against the private sector, so moving the public sector out of the way permits the private sector to flourish. The mechanism is usually portrayed as operating through the real interest rate, with high government borrowing leading to higher interest rates which constrain private sector activity because it is more expensive to borrow.
The prediction is categorical: reduced government expenditure growth will lead to higher private sector growth and at worse unchanged but likely higher GDP growth. The results of austerity are no less categorical, but in the reverse direction. In all countries where government expenditure growth was cut, GDP growth slowed. The only countries where GDP growth increased – Germany and Japan – were those where government expenditure growth was increased.
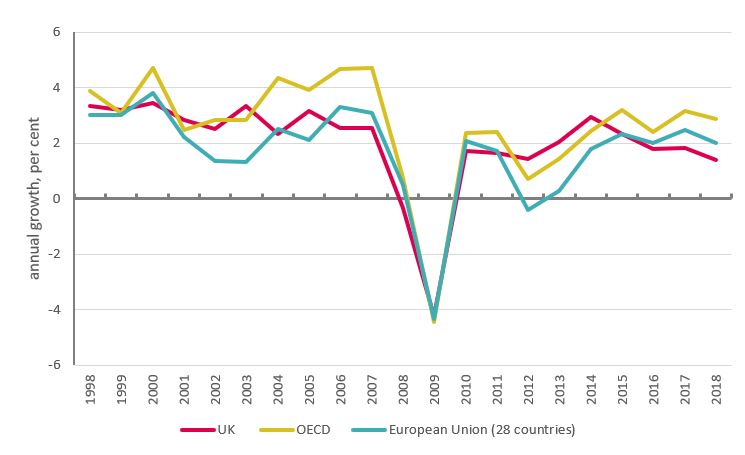
Figure 10 shows annual average growth for real GDP slowing from 3.7 per cent to 2.3 per cent, and corresponding reductions for the UK – from 2.9 to 1.9 - and euro-area – from 2.3 to 1.4. In nominal terms – as with wages – OECD GDP growth slowed by nearly half, from 7.7 per cent to 4.4 per cent.
Figure 10: Real GDP growth
Contributions to growth of the expenditure measure of GDP: UK
Though it is often treated otherwise and regarded as a truism, the claim that private sector expenditure will increase to compensate for cuts in government is a theoretical proposition that can be tested empirically. In the general case, changing the growth of government expenditure is likely to impact on economic growth overall.
Economic activity is normally understood as the result of the combined expenditures of the different sectors of the economy (i.e. government, household, business, overseas). The associated theoretical concept is demand, with aggregate demand the sum of the parts; in practice, demand is measured by the expenditure measure of GDP: GDP(E).
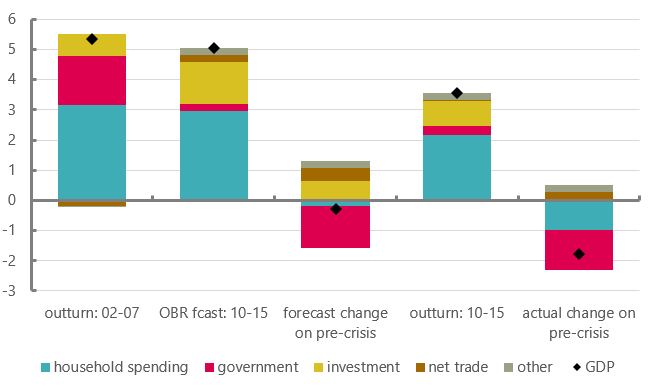
To assess the impact of austerity, the relevant measure is the growth of GDP(E) and the contributions of the various sectors to growth over time. The UK experience is best illustrated starting with the OBR’s original forecast for outcomes over the first parliament of austerity under the Coalition Government. Figure 11 shows annual average growth rates of GDP and the contributions to growth ahead of (2002-2007) and after (2010-2015) the financial crisis.
Regarding austerity economics as a truism, the OBR expected GDP growth over 2010 to 2015 to be little different to the years ahead of the financial crisis; while austerity meant the contribution of government spending to growth would be down to near zero, investment and trade were expected to compensate (columns 2 and 3). But this did not happen, and consumer demand also fell significantly short of expectations (columns 4 and 5). Overall, annual GDP growth slowed materially: (in nominal terms) to 3.5 per cent after the crisis compared to 5.3 per cent ahead of the crisis, a reduction of 1.8 ppts a year.
Figure 11: Expenditure measure of GDP growth, annual average percentage point contributions
Experience across the OECD
Figure 12 shows the reduction in GDP growth across all OECD countries, here using the most up-to-date figures through to 2018 (comparing pre-crisis from 1999-2007 with post-crisis from 2010-2018).
In all (32) countries where government spending growth was reduced, GDP growth was reduced. The only countries with increased GDP growth were Germany and Japan, where government expenditure growth increased. In Sweden, Israel and Chile government spending growth was marginally up but GDP growth was down.
On this basis, the UK decline ranks 7th out of 37 countries (in part because of higher inflation). Apart from Italy, the G7 economies (along with the EA aggregate) come in the top half of the ranking. Half of these countries have declines between 1 and 3 percentage points a year. For clarity, the figures are detailed in the annex, along with pre- and post-crisis growth rates.
The result is categorical, but says less about scale. The normal approach to analysing the effects of fiscal policy on the overall economy is with multipliers.[1]
The simplistic approach to multipliers is to compare the overall changes in (GDP) outcome with changes to government expenditure. Figure 12 suggests an unambiguous positive relationship: the higher the cuts in government expenditure growth, the higher the reduction in GDP growth.
In the case of the UK, the contribution of government expenditure was reduced by 1.3 percentage points a year; comparing with the 1.8 ppts reduction in GDP growth suggests a (negative) multiplier of 1.4 (= 1.8 /1.3). Taking an average across all countries leads to a multiplier of around 4.
But this calculation attributes all the change in economic outcomes to government expenditure, when other factors must be playing a part, not least the severity of the output decline in the first place and the ability and inclination of central banks to support activity.[2]
[1] See Progressive Economy Forum (2019, forthcoming) ‘From false multipliers to nonsense output gaps’.
[2] The sample is also heavily skewed, given the absence of any countries with material increases in government expenditure. Scientifically – let alone socially – more countries with increased spending would help increase the robustness of the results.
Figure 12: Expenditure contributions to change in GDP growth, percentage points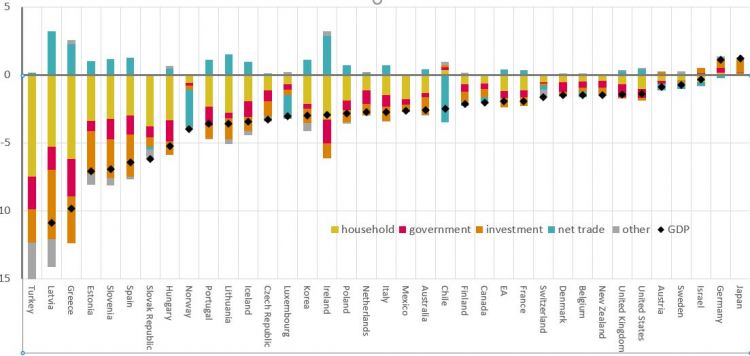
The elevated importance of trade
Structural reforms to promote competitiveness are key to achieving higher growth through more dynamic exports [1]
Under the original policy recommendations, countries were advised to aim for international competitiveness. More directly, with austerity reducing domestic demand, trade has become of even greater importance to output as a whole.
Figure 13, for the average across OECD countries, shows exports (blue) in many years from 2008 accounting for a far greater proportion of overall demand than normal (purple line on right scale). Since the crisis, exports have accounted for half (48.0%) of aggregate demand growth, compared to a third (34.7%) before the crisis (excluding 2008/2009).
The chart also shows how exports have been particularly important to economic revival: first, after the crisis (2010/11); second, after the most intense period of austerity (2014/15); and third, over the latest two years (17/18).[1]
[1] Note the chart is derived as the (unweighted) average experience across OECD counties. These therefore include goods and services that are exported and imported within the OECD (so-called intra-OECD trade). Moreover, imports and exports match quite closely: under ‘global value chains’ the production and distribution of goods and services is coordinated across more than one country, so that increased activity affects trade flows in both directions (these effects are measured by the OECD as ‘trade in value-added’/ TiVA - https://www.oecd.org/sti/ind/measuring-trade-in-value-added.htm).
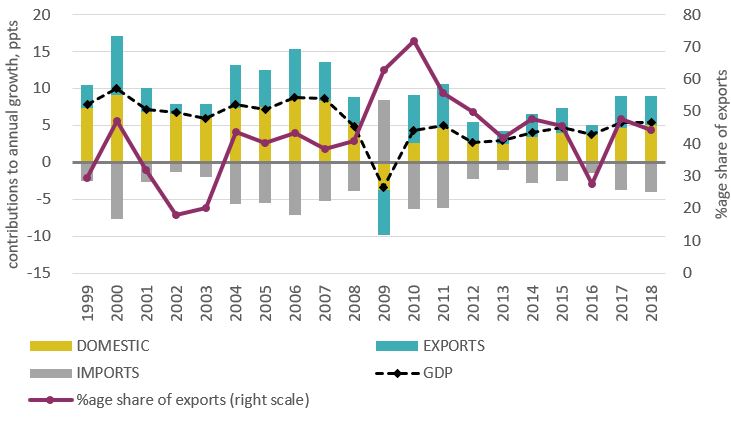
Figure 14 shows the (pre- to post- crisis) change in GDP growth, corresponding to Figure 12 above, with net trade expanded between exports and imports and the domestic demand categories combined.
For the majority of countries the reduction in domestic demand greatly outstrips the reduction in exports; NB Figure 13 showed exports tending to account for a third of growth ahead of the crisis.
Figure 14: Domestic and external contributions to change in GDP growth, percentage points
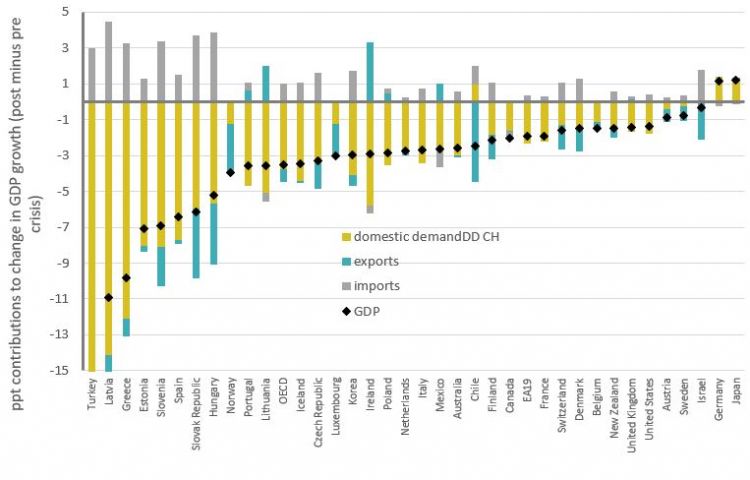
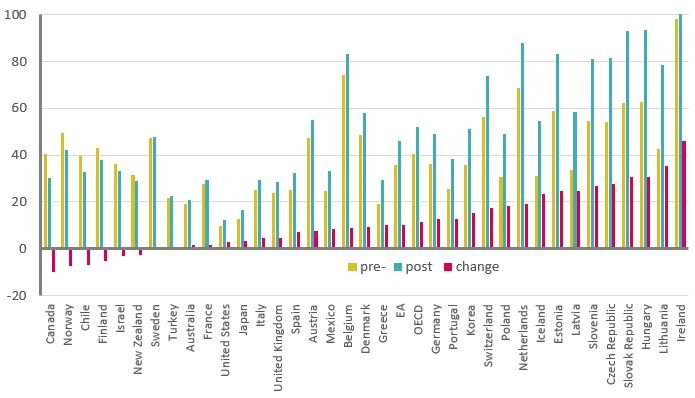
Figure 15 shows a country breakdown of exports as a share of final demand (i.e. domestic demand plus exports) growth before and after the crisis. For the great majority of countries, exports have become more important to GDP growth than ahead of the crisis. The accession countries have the highest increases, from already high levels.
Figure 15: Exports as a percentage share of final demand
Trade growth is reduced in absolute terms, but has become significantly more important in relative terms, given the large reduction in domestic demand. The extent of this relative gain is perhaps surprising, and must result from increased competition and/or the reallocation of production within the OECD (involving winners and losers), the greater importance of global value chains (n. 14) and stronger demand from outside OECD countries.
The trend has likely been exacerbated by post-crisis policy. QE has supported investment flows from advanced to emerging economies (see section 8), and rapid growth in emerging economies has fostered increased trade with advanced economies.
Whether this is desirable must be debatable. While policy is now increasingly protectionist, over the past decade trade has become more not less important as domestic impetus has been contained.[1]
[1] And this is part of a longer-term trend. touchstoneblog.org.uk/2017/01/globalisations-strength-is-through-domestic-demand-thats-why-its-in-crisis/
Stay Updated
Want to hear about our latest news and blogs?
Sign up now to get it straight to your inbox