Lessons from a decade of failed austerity
Wages (nominal and real)
The most obvious and direct impact of austerity has been on wages.
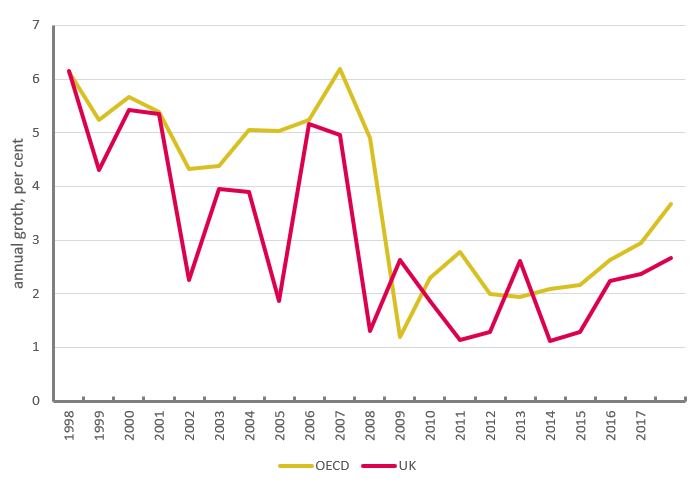
Over the past decade real wage growth has slowed by an average of a half. The OECD average ahead of the crisis was around 5 per cent and since the crisis it has been 2 ½ per cent a year. In the UK, annual wage growth basically halved from 4 per cent to 2 per cent.
Figure 3: Nominal wages, percentage annual growth
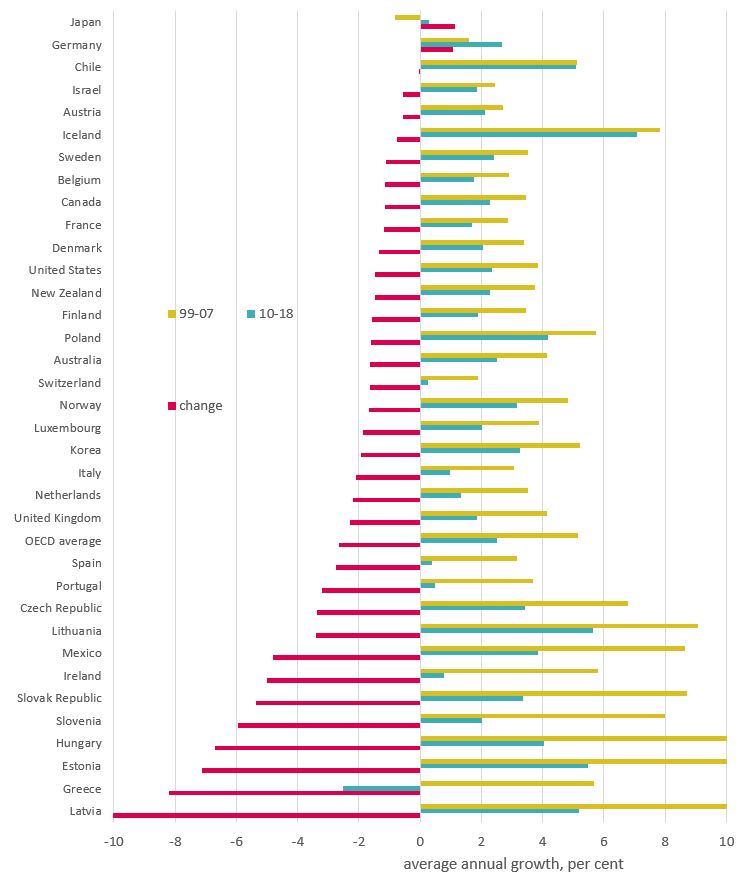
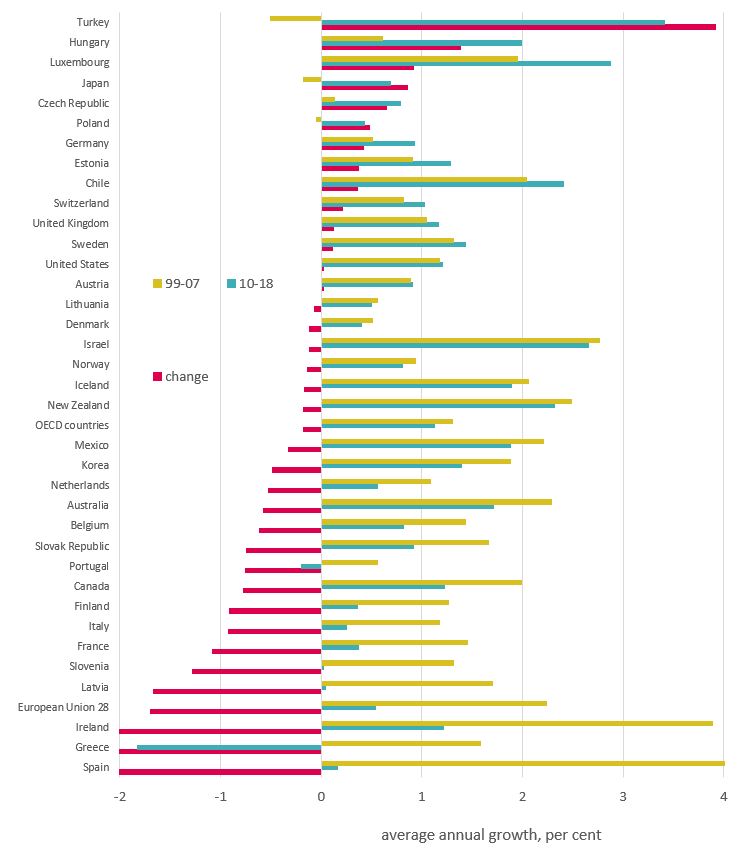
For change in wage growth, the UK is just above the OECD average. The countries with a sharper deterioration are generally understood as less advanced economies, where wages have slowed from very strong pre-crisis growth rates (with post-crisis wage growth now closer or still a little above the norm). Only Japan and Germany have done better on wages since the crisis.
Figure 4: nominal wages by country, average annual growth (%)
Real pay is the key factor for improvements to standards of living. While pay growth has halved, any reduction in inflation has been more moderate.
Overall across OECD countries CPI inflation slowed roughly to 2 per cent from 3 per cent, so OECD real wage growth is down roughly to 1/2 per cent from 2 per cent (strictly 0.9 from 2.2). Mainly because of lower pre-crisis inflation, the UK is one of the few (five) countries where inflation rose a little to 2.1 from 1.7 per cent.
Summary figures for inflation
|
|
Pre-crisis |
post-crisis |
change |
|
UK |
1.7 |
2.1 |
0.4 |
|
US |
2.7 |
1.8 |
-0.9 |
|
EU28 |
2.6 |
1.5 |
-1.1 |
|
OECD |
2.9 |
1.9 |
-1.1 |
Source: OECD
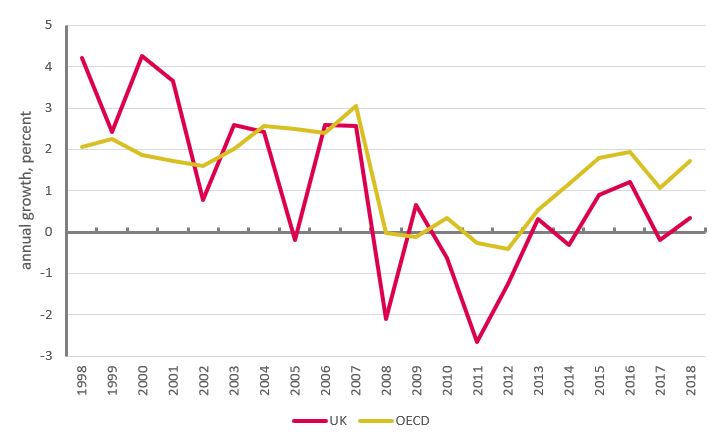
This means that UK wage growth since the crisis has gone negative at an average of -0.3 per cent relative to 2.3 per cent ahead of the crisis.
Figure 5: Real wages, percentage annual growth
Only six countries have enjoyed increased real wage growth: Chile, Israel, Japan, Iceland, Poland and Germany (in ascending order). The countries with the biggest declines are Latvia, Greece, Estonia, Lithuania and the United Kingdom (again in ascending order). Tragically Greece is in a league of its own, with real wages declining in total by 25 per cent since 2008.
Employment
Over recent years, UK employment has grown at a rapid but not exceptional pace. As the UN observe, “United Kingdom employment statistics mirror those experienced in recent years in many countries of the Organization for Economic Cooperation and Development”.[1] From 2015-2017, the UK fell marginally short of OECD (average) employment growth of 1.7 per cent a year. Since the financial crisis, almost half of OECD countries (17/37) have had employment growth of above one per cent a year (Figure 7).
In terms of change in growth, OECD employment growth slowed to 1.1 per cent since the crisis compared to 1.3 per cent before; UK employment growth picked up to 1.2% compared to 1.0% before.
[1] UN (2019) ‘Report of the Special Rapporteur on extreme poverty and human rights on his visit to the United Kingdom of Great Britain and Northern Ireland’: undocs.org/A/HRC/41/39/Add.1
Figure 6: Employment growth
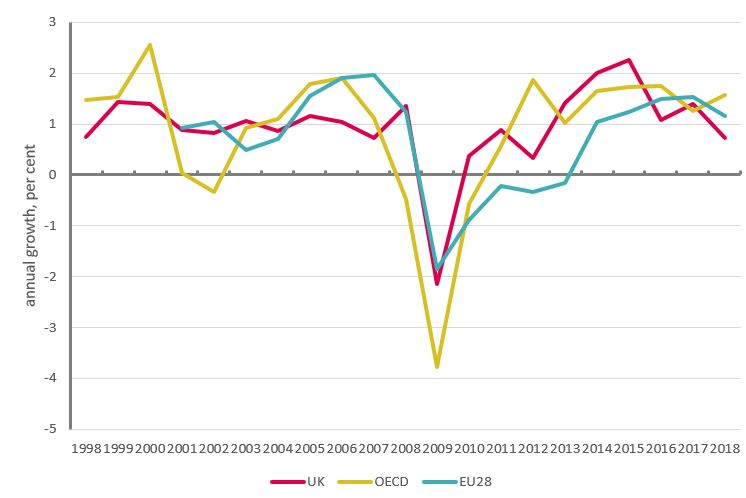
Across the fuller sample of OECD economies, the UK is one of fourteen countries with faster jobs growth since the crisis. These include four of the six countries with faster real wage growth since the crisis (Germany, Poland, Japan and Chile).
Conversely, eight of the ten countries with the most severe deteriorations in employment growth also had severe deteriorations in real pay growth (the exceptions being Canada and France). These comparisons categorically indicate that high jobs growth is not driven by low pay; likewise, low jobs growth is not driven by high pay.
Figure 7: Employment growth by country, annual average per cent
Austerity on the ground
The above charts are necessary for a macroeconomic perspective on the labour market, but fall far short of the impact at the coal face. While the focus of this paper is on the macroeconomic policy behind these choices, here we set out some brief facts about the human impact of austerity.
Just because UK outcomes are in line with many other economies does not detract from the unprecedented failure of wages. Most countries do not have long runs of figures readily available, but in the UK the decline is without precedent in 200 years.[1] While some point at improvements to the income distribution, this is largely the result of levelling down. Weekly wages have declined across the whole income distribution, except for gains in the bottom quintile thanks to the increased minimum wage. Over the latest two years, however, pay at the top end is rising rapidly.[2] The impact on disposable income has been moderated by benefits, but from 2017/18 welfare cuts have begun to hit hard those on the lowest incomes.[3]
The conditions at work have greatly deteriorated since the financial crisis. There are 3.7 million people in insecure work, and nearly two million (1.85m) self-employed people earn less than the minimum wage.[4] The latest numbers of workers employed through zero-hours contracts showed a rise of more than 100,000 since a year ago to 896,000.[5] As the United Nation’s special rapporteur has confirmed, for too many work is no longer a route out of poverty. Overall levels of poverty in the UK are little changed in 15 years, but the number of people in working households living in poverty in Britain has increased from 5 million to 8 million (Figure 8).
[2] ‘Pay for the top 1% rockets but working people still feel the squeeze’, Alex Collinson, TUC blog, 12 October 2019. www.tuc.org.uk/blogs/pay-top-1-rockets-working-people-still-feel-squeeze
[3] ‘Britain's broken politics: Tax cuts for the rich, frozen benefits for working families’, Anjum Klair, TUC blog, 1 April 2019. www.tuc.org.uk/blogs/britains-broken-politics-tax-cuts-rich-frozen-benefits-working-families.
[4] TUC (2019) ‘A stronger voice for workers: How collective bargaining can deliver a better deal at work’, September. www.tuc.org.uk/research-analysis/reports/stronger-voice-workers
[5] TUC (2019) ‘Jobs and pay at risk from no-deal Brexit’, 13 August. www.tuc.org.uk/news/jobs-and-pay-risk-no-deal-brexit-says-tuc
Figure 8: In work poverty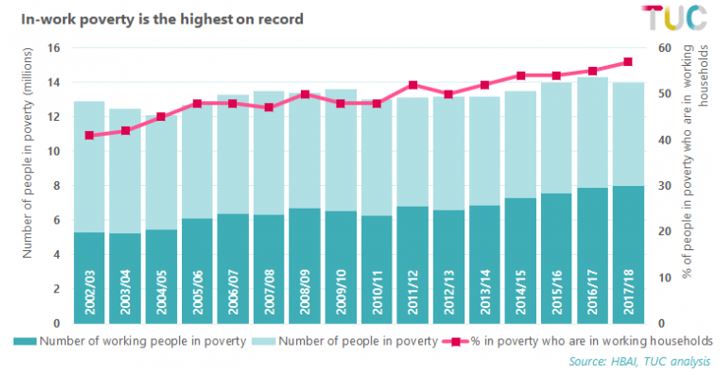
Inadequate incomes feed through to bottom line. Savings have been sustained at historic lows, and many households are increasingly having to resort to credit to get by. In the UK unsecured debt is at a record high, and the National Audit office report 8.3 million households struggling with debt.[1]
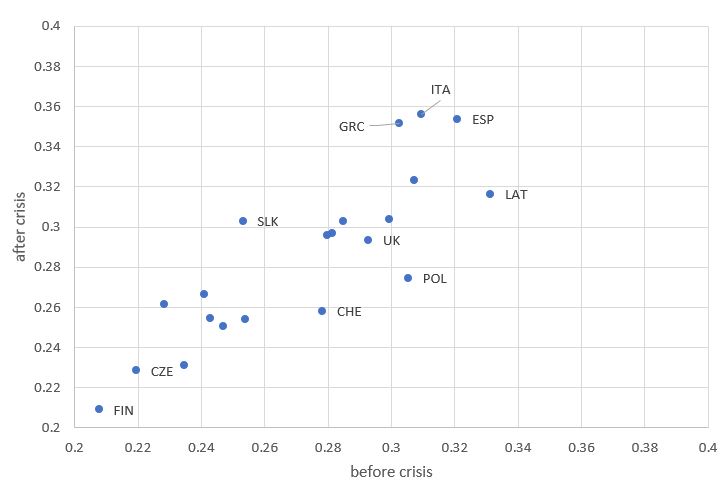
Nor is poverty exclusive to the UK. In a large majority of OECD countries (with relevant figures available), poverty has increased since the global financial crisis. Figure 9 shows a standard measure, with poverty rising in all countries to the left of the diagonal.[2]
[2] The ‘Poverty gap’ is based on equivalised post-tax and transfer incomes, and compares how far the incomes of the poor fall below a poverty line (here, 60% of median income). Before crisis corresponds to an average across 2004-2008 and after crisis to an average across 2009-2017; some averages are based on partial information across years.
Stay Updated
Want to hear about our latest news and blogs?
Sign up now to get it straight to your inbox