Working people won’t be celebrating more than a decade of lost wages
After almost 12 years, real wages have finally returned to levels not seen since the 2008 financial crisis.
The latest statistics show that real weekly wages are up to £474, the same as their April 2008 peak.
A return to pre-recession wage levels is only that: a return to where we already were around 12 years ago.
That’s hardly something a government that’s been in power for ten of those 12 years should be proud of.
And it’s important to point out that real wages have only returned to pre-crisis levels when calculated using the most favourable measure of inflation – the CPIH.
If calculated using the CPI measure that we prefer, real weekly wages are still £11 lower than their pre-crisis peak.
After the longest wage squeeze for a century, working people are certainly not feeling any better off.
So instead of celebrating a return to where wages were over a decade ago, it’s time for the government to start fixing Britain’s broken economy.
Back to where we were
Figures released by the Office of National Statistics (ONS) today show that real weekly wages now stand at £474, slightly higher than their April 2008 peak.
As we explain below, whether that means they’ve finally returned to pre-recession levels is up for debate.
But even on a generous interpretation, real pay growth between April 2008 and December 2019 was completely flat.
No wage growth across an almost 12-year period is terrible by any standard.
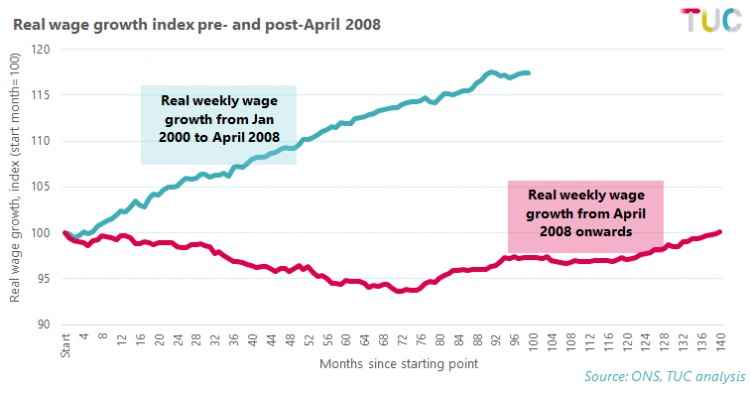
To put it in context, in the 8 years and 4 months leading up to the April 2008 peak real wages grew by 17 per cent.
In the equivalent 8 years and 4-month period following the recession, real wages fell by 3 per cent.
If they had grown by that pre-recession 17 per cent, they would have been £95 per week higher than they were (£555 compared to £460).
And if real weekly wages had kept growing at the same rate as they were before in the year before the crisis hit, they would now be £590 (£116 higher than they actually are).
But almost 12 years since the crisis, real wages have not grown at all.
Even if we calculate real wage growth by the most favourable measure, they’re just back to where they were in 2008.
After ten years in power, that’s an odd thing for a government to be shouting about
Historically, this is bad. This pay squeeze has already lasted longer than any pay squeeze we saw in the 20th century .
On top of that workers have had to cope with ten years of damaging Tory austerity, including the introduction of Universal Credit, the benefits freeze, and years of cuts to vital public services.
The impact is clear. In-work poverty is at a record high . Household debt is also at a record high, with dramatic rises in individual insolvencies . And debt advice services and food banks are busier than ever.
Inflation matters
The technical point might sound a bit boring, but it’s important: we haven’t actually returned to pre-crisis real wage levels.
‘Real wages’ are wages once inflation is taken into consideration. It’s important to consider inflation as wage growth means little to you if the prices of the stuff you buy are going up by more than your pay.
The problem, however, is that there isn’t just one measure of inflation. There are three main ones:
· Consumer Prices Index (CPI)
· Consumer Prices Index including owner occupiers’ housing costs (CPIH)
· Retail prices index (RPI)
You can read more about the differences between these and why they matter in a previous blog . In this context what’s important is that the three measures vary quite a bit, and this affects our understanding of real wage growth.
The ONS uses CPIH to calculate its real wage figure. Of the three measures, CPIH gives the most favourable view of real wages since 2008.
Using the ONS’s methodology (CPIH and 2015 as the base year), real weekly wages are at £474, £1 above their pre-crisis peak.
But if we use CPI, as the TUC and many others usually do, real weekly wages are still £10 lower than their pre-crisis peak.
And if we use RPI, the situation is even worse, with real weekly wages being £49 below their peak.
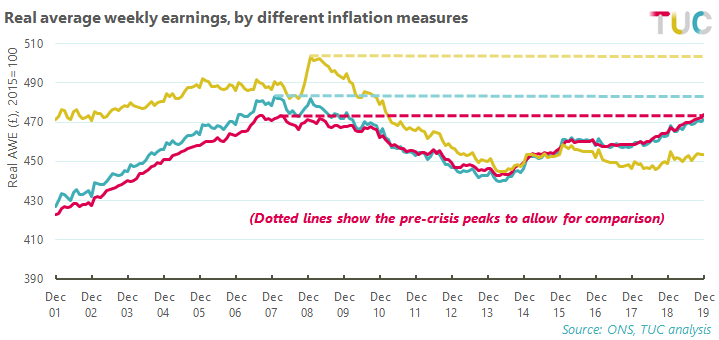
It’s worth noting two things here. Firstly, to be consistent with the ONS we’ve used 2015 as the base year for both the RPI and CPI calculations, whereas we usually use current day as the base.
Secondly, the ONS has withdrawn RPI’s status as a national statistic and discouraged its use. This is a controversial decision that we and others disagree with .
What’s most important is not the debate about inflation measures or baselines, but that real wages are only back to 2008 levels by the CPIH measure.
Fixing the wage crisis
Just getting wages back to where they were over ten years ago isn’t good enough. After all, think about all the lost wages that workers have lost across those 12 years.
Now is not the time for celebration, it’s the time for the government to start fixing our broken economy.
That means a new minimum wage of £10 per hour as soon as possible and a strategy to ensure decent workplace rights across the country , using promised infrastructure spending to deliver better jobs.
And unions need access to every workplace so we can negotiate better pay and conditions for everyone at work.
Stay Updated
Want to hear about our latest news and blogs?
Sign up now to get it straight to your inbox