Levelling up at work - fixing work to level up across the UK
For most people, work is their main source of income throughout their lives. But for all of us, there will be times that we are unable to work. These include periods of old age, ill-health or when we are unable to find suitable work. And, of course, it includes time spent on the all-important role of bringing up the next generation, who need and deserve the very best start in life their families can give them.
People need economic security throughout every part of their lives. That’s why levelling up requires a strong welfare safety net that supports people when they need it. We need a decent pension system, sick pay for all and a social security system that enables people to live in dignity.
Pensions and older workers
State pension age
Since 2010, the state pension age (SPA) has been increased from 60 for women and 65 for men to 66 for everyone. Current plans for further increases will take the SPA to 68 by the late 2030s. The government’s stated intention is to make sure the proportion of adult life citizens spend in receipt of the state pension does not rise above 32 per cent “in order to keep the State Pension sustainable and maintain fairness between generations in the future”.[1] But the UK’s deep inequalities in labour markets, health outcomes and longevity mean the effect of these changes will not be felt uniformly across the country. The number of people forced out of the labour market before they reach the current SPA varies markedly across different regions and by occupation.
TUC research in 2021 found that more than a third of process, plant and machinery operatives and people in elementary occupations who have become economically inactive in their 60s have left work because of chronic health issues.[2] More than a quarter of economically inactive people whose last job was in the skilled trades, caring or leisure sector, or sales also reported long-term health problems. These ratios compare with just one in 12 and one in 20 for senior managers and those working in the professions. The occupations in which people are more likely to become economically inactive because of caring responsibilities are administration and secretarial, caring and leisure, process, plant and machinery operatives, and elementary occupations.
There are also significant regional variations. Across the country one in eight people are forced out of work early by ill health, but this rises to one in six in the North East and more than one in five in Northern Ireland. In the South West and West Midlands, by contrast, one in twelve people aged 60-65 are economically inactive because of poor health.
The disparities are even more pronounced when looking at smaller geographical units. Breaking the country down into areas of approximately 1,500 residents, the differences in healthy life expectancy - the amount of time someone can expect to be in “good health” during their life - the gaps between rich and poor areas is alarming. In 2012 the healthy life expectancy gap between the most and least deprived men was approximately 18 years, with men from the poorest areas experiencing 13 years of ill health on average before they could access their state pension.[3] Between 2012 and 2017, healthy life expectancy improvements stalled for men and actually decreased by around six months for women. And the gap between the most and least deprived areas grew by 8 per cent over the same period. On the current trajectory of state pension age increases, women in the most deprived areas are projected to spend an average of just over 16 years in ill health before they reach state pension age.
This growing gap between healthy life expectancy and SPA in many areas means growing numbers of older workers will be forced out of the labour market before they can draw their state pension, leading to an increasing reliance on working age benefits, and higher poverty rates among older workers in these areas.
State pension level
The state pension is one of the most universal state benefits, with 98 per cent of couples and 97 per cent of single people over SPA receiving it. But it is the poorest pensioners who are most dependent on it for their income. Pensioner couples in the lowest and second lowest earnings quintiles rely on state benefits – principally the state pension – for £4 in every £5 and £2 in every £3 of income respectively. For single pensioners the reliance is even higher, with almost £9 in every £10 coming from this source.[4]
This means that, unless we want to increase the dependence on means testing (which will discourage participation in occupational pensions and private retirement saving), the state pension is the most effective tool for raising living standards among poorer pensioners.
Replacing just 28.4 per cent of average pre-retirement income, our state pension is currently less than half as generous as the EU average, and just over half the average among OECD countries.[5] This is largely the result of the decision in 1980 to de-link state pension increases from earnings growth, with the state pension losing 40 per cent of its value relative to earnings in the following decades. Even when including voluntary retirement savings, replacement rates are still well below the OECD average.
In this context the government’s decision to suspend the earnings link within the triple lock for 2022 was disappointing.
We can see from the table below that regions of the country in which pensioners are most reliant on the state pension and other benefits tend to have the lowest pensioner incomes. So in the West Midlands for example, the median pensioner couple relies on state benefits for 55.5% of income and has a net income after housing costs 8 per cent lower than the national average for pensioners. In the South East, by contrast the median pensioner relies on benefits for just 40% of income and has an income 16 per cent higher than the national average. London is the one outlier to this trend, with high housing costs there meaning pensioners in the capital have particularly low incomes after housing costs.
Increasing the state pension would do more to boost incomes in those regions of the country where pensioners are most reliant on state benefits and where pensioner incomes are generally lowest.
Median levels and sources of income for pensioners by region, 2017/18 to 2019/20
|
Region |
Pensioner couples |
Single Pensioners |
||
|
% difference of net income after housing costs from UK average |
% of gross income coming from benefits |
% difference of net income after housing costs from UK average |
% of gross income coming from benefits |
|
|
North East |
-1% |
50.8 |
-2% |
72.3 |
|
North West |
-7% |
55.2 |
-1% |
67.2 |
|
Yorkshire and the Humber |
-8% |
52.8 |
-3% |
66.9 |
|
East Midlands |
-2% |
50.5 |
3% |
64.6 |
|
West Midlands |
-8% |
55.5 |
-3% |
69.4 |
|
East |
6% |
44.8 |
-1% |
60.7 |
|
London |
-11% |
48.8 |
-14% |
61.9 |
|
South East |
16% |
40.0 |
3% |
59.0 |
|
South West |
7% |
45.4 |
4% |
60.5 |
|
Wales |
0% |
50.0 |
1% |
61.8 |
|
Scotland |
2% |
50.0 |
6% |
64.0 |
|
Northern Ireland |
3% |
52.2 |
7% |
71.2 |
Source: ONS Pensioners’ Income Series
Pensioner spending power
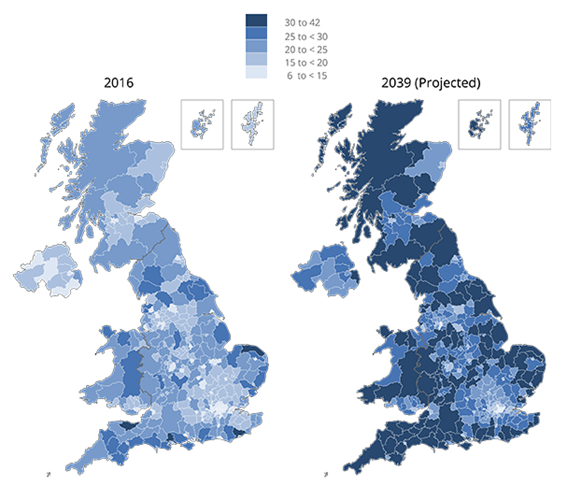
The pensioner population in the UK is skewed away from urban centres and London in particular, and towards more rural areas and coastal towns. According to ONS figures, all of the 10 local authorities with the highest percentage of the population aged 65 years and over are on the coast, with five in the South West.[6] Nine of the 10 local authorities with the lowest population aged 65 and over are in Greater London. Looking at the regional level, the percentage of over 65s in the population is almost twice as high in the South West (21.6 per cent) as it is in Greater London (11.6 per cent).
[1] DWP, State Pension age review, https://assets.publishing.service.gov.uk/government/uploads/system/uploads/attachment_data/file/630066 /print-ready-state-pension-age-review-final-report.pdf
[2] TUC, Extending working lives: How to support older workers - https://www.tuc.org.uk/research-analysis/reports/extending-working-lives-how-support-older-workers
[3] Pensions Policy Institute briefing note 125: Longevity Inequality - https://www.pensionspolicyinstitute.org.uk/media/3680/20201209-ppi-bn125-longevity-inequality-final.pdf
[4] Age UK, Poorest pensioners almost solely dependent on the State Pension to get by - https://www.ageuk.org.uk/latest-news/articles/2018/january/poorest-pensioners-dependent-on-state-pension/
[5] OECD Pensions at a glance, https://data.oecd.org/pension/net-pension-replacement-rates.htm
[6] ONS, Living longer: how our population is changing and why it matters – https://www.ons.gov.uk/peoplepopulationandcommunity/birthsdeathsandmarriages/ageing/articles/livinglongerhowourpopulationischangingandwhyitmatters/2018-08-13
Proportion of the population aged 65 years and over, 2016 and 2039, UK
This means that any extra spending on the state pension will have a larger economic impact in the areas most in need of levelling up by increasing the spending power of pensioners living there. Poorer pensioners, who are most reliant on the state pension for income, are particularly likely to spend any extra income they receive, boosting local economies in areas with low level of pensioner income.
Policy recommendations
· The government should shelve scheduled increases to the SPA to prevent the gap between healthy life expectancy and SPA in many parts of the country widening.
· Ahead of the next planned SPA review in July 2023, the government should establish a cross-party commission to examine options including varying the state pension age to take account of differences in life expectancy and healthy life expectancy and giving people increased flexibility over when and how they access their state pension.
· To raise living standards among poorer pensioners across the country and support local economies, the government must maintain the triple lock, at least until the UK state pension reaches the level of comparable countries, and reinstate the earnings link for the 2022 uprating.
Universal credit
The Government has recently cut the £20 uplift from Universal Credit, removing a lifeline for the 6 million claimants of Universal Credit. Forty percent of these claimants – over two million people - are in work, reflecting the UK’s high levels of in-work poverty, as set earlier in this report.
The government has justified the cut by saying its focus is to move people into jobs – but given that four in ten people on Universal Credit are already in work, this makes little sense.
As the table below shows, across every region and nation of the UK, over one third of Universal credit recipients are in work.
Numbers on Universal Credit in work by region/nation (May 2021):
|
Region/nation |
Number in work receiving UC |
Total number receiving UC |
% Of UC recipients in work |
|
North East |
100,437 |
281,759 |
35.6% |
|
North West |
282,131 |
755,400 |
37.3% |
|
Yorkshire & Humber |
194,344 |
518,269 |
37.5% |
|
East Midlands |
166,265 |
403,272 |
41.2% |
|
West Midlands |
214,730 |
585,069 |
36.7% |
|
East of England |
199,459 |
494,271 |
40.4% |
|
London |
375,426 |
1,015,321 |
37.0% |
|
South East |
274,235 |
677,609 |
40.5% |
|
South West |
184,983 |
439,612 |
42.1% |
|
Wales |
103,609 |
279,068 |
37.1% |
|
Scotland |
176,935 |
481,263 |
36.8% |
|
Total |
2,274,976 |
5,938,914 |
38.3% |
Source - TUC analysis of stat explore data using May 2021 data – for constituency level data see press release
Even with the £20 uplift, the basic rate of universal credit was worth around just a sixth of average weekly pay. The UK system is strikingly less generous than in most other European countries, where unemployment benefits are related (at least in the initial period of unemployment) to previous wages to cushion income shocks, ranging from 60 per cent of previous wages in Germany to 90 per cent in Denmark[1].
We need a benefit system that enables people to live in dignity throughout their lives.
· The cut in Universal Credit must be reversed, and Universal Credit should be increased to at least 80 per cent of the level of the living wage, around £260 a week.
Sick pay for all
According to TUC analysis, two million workers in the UK do not earn enough to qualify for statutory sick pay (SSP) – and 70 per cent of these workers are women.
Research by the Fabian Society, commissioned by the TUC, shows that removing the lower earnings limit, which prevents those on low earnings from accessing statutory sick pay, would cost employers a maximum of £150m a year. And it would cost the government less than one per cent of the test and trace scheme to support employers with these costs.[2]
The research also finds that on average the cost of raising statutory sick pay to a Real Living Wage for employers without an occupational sick pay scheme would be around £110 per employee per year – or just over £2 a week.
The self-isolation payments scheme, which is meant to help those struggling to self-isolate for financial reasons, is failing. Recent TUC research found that around two-thirds of applicants have been rejected from the scheme and that just 16 per cent of those who do not receive SSP are aware of the scheme.[3]
Every worker must be able to access sick pay, paid at the real living wage.
· We need to reform our statutory sick pay system, removing the lower earnings limit and raising payment levels to the Real Living Wage.
[1] TUC (2020) Fixing the safety net: Next steps in the economic response to coronavirus https://www.tuc.org.uk/research-analysis/reports/fixing-safety-net-next…
[2] Andrew Harrop (2021) Statutory Sick Pay Options for Reform https://fabians.org.uk/publication/statutory-sick-pay/
[3] TUC (18 June 2021) “A failing scheme few people have heard of” - TUC urges sick pay reform as number of self-isolation grants awarded remains low https://www.tuc.org.uk/news/failing-scheme-few-people-have-heard-tuc-ur…
Stay Updated
Want to hear about our latest news and blogs?
Sign up now to get it straight to your inbox
