Levelling up at work - fixing work to level up across the UK
Why does work matter? The impact of work on quality of life
The quality and quantity of work that people undertake has a huge impact on their wellbeing. Most obviously, it is a crucial determinator of income and how well-off people are – whether they struggle to buy food for their family or are able to budget comfortably for daily life, leisure and holidays and save for the future. But work also has a significant impact on other critical areas of people’s lives, in particular their health.
The strong link between work and health outcomes was underlined by the Marmot Review of 2010[1], which was set up under the leadership of Sir Michael Marmot to examine “the most effective evidence-based strategies for reducing health inequalities”. One of its six recommendations was to “create fair employment and good work for all”.
The Marmot review recognised that being in good employment is generally good for health, while unemployment, especially if it is long-term, contributes significantly to poor health. However, it concluded that being in work is not automatically good for health and found that a poor quality or stressful job can be more damaging to health than unemployment. Therefore: “Getting people off benefits and into low paid, insecure and health-damaging work is not a desirable option”.
The Marmot review set out five characteristics of work that evidence shows are damaging to health:
· job insecurity and instability
· low levels of control (over how the job is done)
· high levels of demand at work, especially when combined with low levels of control
· lack of supervisor and peer support
· more intensive work and longer hours.
As the Review sets out, these work characteristics are linked to a range of mental and physical health impacts, including depression, cardiovascular disease, coronary heart disease and musculoskeletal disorders and metabolic syndrome (a combination of risk factors for diabetes and heart disease). Research clearly shows that work quality is directly linked to health outcomes and poor work quality increases the risk of being in poor health.
The Health and Safety Executive (HSE) has produced guidance to help employers reduce workplace stress, focusing on six areas of work design that “if not properly managed, are associated with poor health, lower productivity and increased accident and sickness absence rates”[2]. The six areas - demand, control, support, relationships, understanding of role and management of change – closely correlate with the work characteristics highlighted by the Marmot Review. Unfortunately, HSE annual statistics report an increase in both the proportion and number of workers suffering work-related stress has increased in recent years[3]. The HSE’s 2020 Annual Statistics (covering the period up to March 2020) reported that in 2019/20, 828,000 workers suffered from work-related stress, depression or anxiety, leading to 17.9 million lost working days.
Boris Johnson’s July speech quoted some of the appalling postcode health inequalities, citing the extra decade of average healthy life expectancy of a woman from York compared to Doncaster 30 miles away. But these postcode health inequalities also reflect differences in occupation, work quality and pay.
In a recent report[4], the TUC found that people who left the labour market early while working in low-income jobs - like cleaning, care and manual labour - were six times more likely to quit for medical reasons than those in higher-paid jobs.
One in three low-paid workers who left their jobs before state pension age did so because of ill health. By contrast, just one in twenty professionals who left the labour market early did so because of long-term sickness.
The link between work and income is clear – different jobs are paid different amounts and so pay differentials across the economy are a significant contributor to income differentials and inequality, in particular for the working age population.
A distinctive feature of the UK labour market is the fact that so many working people remain in poverty.
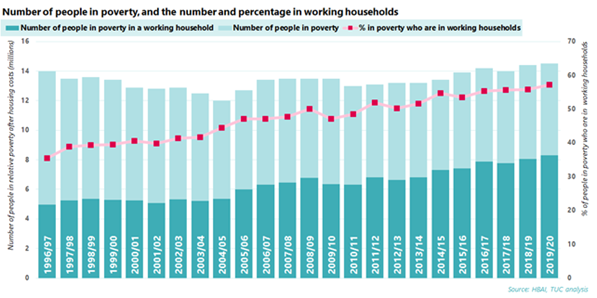
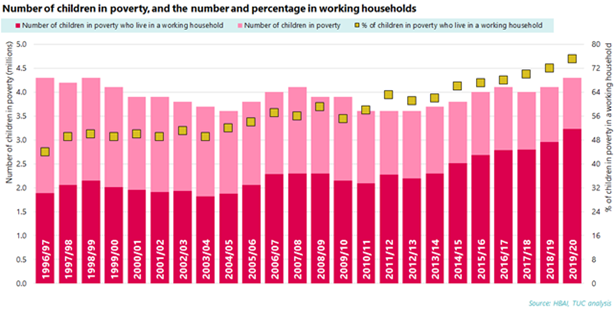
The most recent data, for 2019/20, shows the number of people living in poverty reaching 14.5 million, a record high. The number of children living in poverty reached 4.3 million, up 200,000 from the previous year. And of those living in poverty just before the pandemic hit, a record-high 57 per cent (8.3 million people) were in working households. And 75 per cent of children living in poverty are from working households. At the moment, the government’s mantra that work is the best route out of poverty, simply isn’t true. To ensure that work is the best route out of poverty, we need to improve work quality and pay – we need to level up at work.
The charts below shows that the number of people and children in poverty has risen over time and shows the number and proportion of people in poverty who are in a working household.
[1] Michael Marmot, Peter Goldblatt, Jessica Allen, et al. (2010) Fair Society Healthy Lives (The Marmot Review), available at https://www.instituteofhealthequity.org/resources-reports/fair-society-healthy-lives-the-marmot-review
[2] HSE Causes of stress at work https://www.hse.gov.uk/stress/causes.htm
[3] Health and Safety Executive (4 November 2020) Work-related stress, anxiety or depression statistics in Great Britain, 2020 https://www.hse.gov.uk/statistics/causdis/stress.pdf Nb figures cover the period to March 2020 and the HSE does not consider COVID-19 to be the main driver of the increase.
[4] TUC (2021) Extending working lives How to support older workers, available at https://www.tuc.org.uk/research-analysis/reports/extending-working-lives-how-support-older-workers
Timeline of number of people in poverty, with working household breakdown
Timeline of number of children in poverty, with working household breakdown
As the next section will show, the working poor are not found in some regions or towns only; they are found in every region, every town and every city across the UK. We cannot address disadvantage and level up the country without addressing the problems of poor-quality work and low pay. Without a chance of a decent secure job, no community will feel that their chances have been ‘levelled up’.
Low pay across the UK
Across the UK in 2019, one in five jobs (20.5%) or five million jobs in total was paid less than the Real Living Wage - currently set at £10.85 in London and £9.50 across the rest of the UK[1]. (In 2019, at the time of the analysis, the figures were £10.55 in London and £9.00 across the rest of the UK – we have used the 2019 figures as the 2020 figures were distorted by the number of employees on furlough).
While the share of low paid jobs is higher in some regions than in others, a significant proportion of workers are low paid in every region and nation of the UK. Across the UK as a whole, in 2019 in 62% of constituencies more than one in five jobs were paid below the Real Living Wage. Across the North East, West Midlands and Wales the share was more than three quarters, in London it was 84% and in Yorkshire and the Humber every constituency had high rates of low pay. The lowest rates of low pay were in the South East and then Scotland.
The table below shows the share of parliamentary constituencies in each region or nation of the UK with more than 20 per cent of employees paid below the Real Living Wage (labelled as constituencies with high levels of low pay).
As this data excludes the self-employed, it will significantly underestimate the total extent of low pay. TUC analysis in 2019 found that almost half of self-employed adults aged over 25 were earning less than the legal minimum wage[2]. Our current estimate of the total number of self-employed workers who are paid below the legal minimum wage is 1.91 million[3].
Low pay (pay below the Real Living Wage) across the regions and nations of the UK, 2019[4]
|
|
Percentage of employees on low pay |
Number of employees on low pay |
Constituencies with high levels (over 20%) of low pay |
|
|
Number |
Percentage |
|||
|
North East |
22.6 |
229,000 |
22 |
76 |
|
North West |
21.1 |
629,000 |
53 |
71 |
|
Yorkshire and the Humber |
22.1 |
492,000 |
57 |
100 |
|
East Midlands |
22.8 |
432,000 |
17 |
40 |
|
West Midlands |
21.7 |
488,000 |
46 |
78 |
|
East |
18.8 |
471,000 |
30 |
52 |
|
London |
19.8 |
839,000 |
61 |
84 |
|
South East |
15.9 |
610,000 |
21 |
25 |
|
South West |
20.4 |
482,000 |
29 |
53 |
|
Wales |
22.6 |
268,000 |
31 |
78 |
|
Scotland |
16.9 |
400,000 |
24 |
41 |
|
Northern Ireland |
25.1 |
227,000 |
n/a |
n/a |
|
UK |
20.5 |
5,568,000 |
391 |
62% |
[2] ONS, TUC analysis https://www.tuc.org.uk/blogs/almost-half-self-employed-are-poverty-pay
[3] see footnote 15 for source
[4] Annual Survey of Hours and Earnings (ASHE) - Estimates of the number and proportion of employee jobs with hourly pay below the living wage, by work geography, local authority and parliamentary constituency, UK, April 2018 and April 2019; constituency counts were derived by the TUC.
The heat map below presents a graphical version of the same information. It demonstrates that constituencies with high rates of low pay are relatively evenly distributed across the whole of the UK. The darkest red corresponds to shares around 50 per cent and the darkest blue to shares of less than 10%.
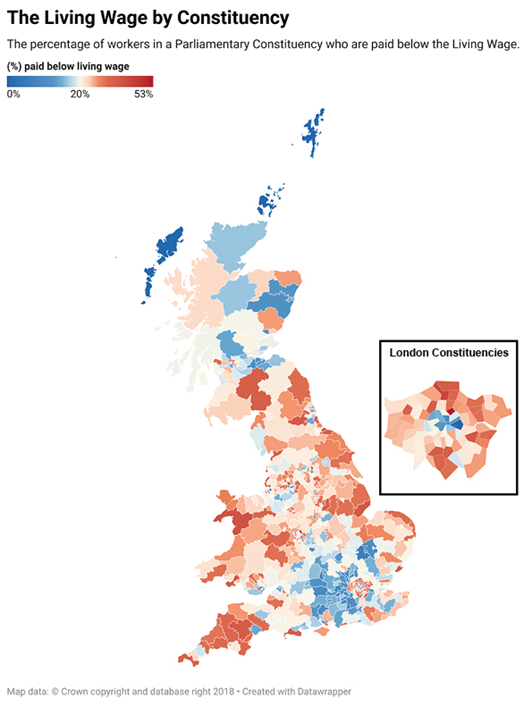
It is high pay, rather than low pay, that is unevenly distributed and tends to be focussed in a smaller number of areas. IFS analysis[1] shows the highest earning local authorities concentrated in London, and then the South East and East of England.
The prevalence of high-paid jobs in London means that comparisons between London and other regions can give rise to statistics that make it look as though the streets of London are paved with gold. But that is just a fairy story and the reality is much more complex – of the ten constituencies with the highest share of low paid workers, eight are in London and the list is topped by Hackney North and Stoke Newington, where over half (53%) of jobs are paid less than the Real Living Wage.
The story of London is that the prevalence of high paid jobs does not automatically pull up incomes for others in the local community. The prevalence of higher income work will create additional local economic demand, in particular in the service sector; but as long as so many service sector jobs remain low paid, this has the effect of expanding the low paid local economy, rather than fostering rising incomes across the board.
The prevalence of low paid work across all regions and nations means that in-work poverty is high across all regions and nations, as shown by the table below:
Rates of in-work poverty by region and nation[2] (data is a 3-year average)
|
|
2017/18 - 2019/20 |
|
North of England |
17.7% |
|
South of England and East |
15.2% |
|
London |
21.8% |
|
Midlands |
17.6% |
|
Wales |
17.6% |
|
Scotland |
13.7% |
Department for Work and Pensions [DWP] (2020a) ‘Households below average income (HBAI)’ dataset
Sectors and occupations
The reason that low pay is so common across all areas of the country is that many sectors and occupations that employ large numbers of people across the UK are poorly paid.
The table below looks at the top employing sectors in each of the UK’s regions and nations (with the top employing sector highlighted in darkest green, and the fifth largest employing sector in the lightest green).
Largest employing sectors in the UK, regions and nations (workforce jobs, June 2021)
|
Industry |
UK |
North East |
North West |
Yorkshire and the Humber |
East Midlands |
West Midlands |
East |
London |
South East |
South West |
Wales |
Scotland |
Northern Ireland |
|
% of workforce jobs |
|||||||||||||
|
Wholesale and retail trade; repair of motor vehicles and motorcycles |
13.9 |
13.9 |
14.7 |
13.9 |
14.9 |
15.7 |
14.6 |
10.6 |
15.0 |
14.2 |
13.8 |
13.0 |
15.2 |
|
Human health and social work activities |
12.9 |
15.9 |
13.9 |
14.1 |
12.2 |
13.0 |
12.3 |
10.6 |
12.1 |
12.7 |
14.9 |
14.6 |
16.5 |
|
Professional, scientific and technical activities |
9.2 |
6.4 |
9.9 |
7.0 |
8.3 |
7.9 |
10.0 |
13.4 |
9.6 |
8.1 |
5.4 |
8.1 |
5.3 |
|
Administrative and support service activities |
8.4 |
7.6 |
8.5 |
8.6 |
8.4 |
9.4 |
9.4 |
10.0 |
7.7 |
6.6 |
6.1 |
7.8 |
6.3 |
|
Education |
8.4 |
8.6 |
7.7 |
8.9 |
8.5 |
8.9 |
9.0 |
6.9 |
9.4 |
8.3 |
9.4 |
7.9 |
9.2 |
|
Manufacturing |
7.3 |
8.8 |
8.4 |
10.4 |
10.8 |
10.1 |
6.7 |
2.3 |
6.0 |
8.0 |
10.0 |
6.6 |
10.5 |
|
Accommodation and food service activities |
6.8 |
6.6 |
6.7 |
6.0 |
5.7 |
6.2 |
5.9 |
7.0 |
6.6 |
8.6 |
8.7 |
7.4 |
5.8 |
Source: Workforce jobs by industry, June 2021, accessed via nomis
Wholesale and retail and human health and social work activities dominate employment across the UK. Wholesale and retail is a low paid sector, with a median wage of £10.30 in 2020 (compared to a UK median of £13.68) and a significant 35 per cent of jobs paid below the real Living Wage in 2019.
Human health and social care incorporates a wide variety of jobs and has a higher median wage of £13.73 - but nearly one in five jobs, 18.1 per cent, were paid below the real Living Wage in 2019 – suggesting considerable potential for improving wages in this sector.
Accommodation and food services is the lowest paid sector in the UK, with a median wage of £8.72, and a shocking 63 per cent of employees paid below the real Living Wage. It’s notable that this is a top five employer in three parts of the country - London, the South West and Wales.[3]
The next table looks at the largest employing occupations across the regions and nations. Again, two low paid sectors, caring and elementary service occupations, make up a large share of jobs in most parts of the UK. Those working in elementary service occupations – for example in hospitality – make up a significant part of the workforce (over 7 per cent) everywhere except London, the South East and Northern Ireland – but 59 per cent of employees in these jobs were paid less than the real Living Wage in 2019, and the median wage was just £9.17 in 2020.
Caring and personal service jobs formed a similar proportion of the workforce (over 7 per cent) everywhere except London and the East; 35 per cent of them earned less than the Living Wage (with a median wage of £10.13). Sales occupations, which stand out as significant jobs in the North East and Northern Ireland (and make up around five per cent of employment in most regions except London) are paid a median of £9.30, and 59 per cent earned below the real Living Wage in 2019.[4]
Largest employing occupations in the UK, regions and nations (annual population survey, June 2021)
|
Employment by occupation - % |
UK |
North East |
North West |
Yorkshire and the Humber |
East Midlands |
West Midlands |
East |
London |
South East |
South West |
Wales |
Scotland |
Northern Ireland |
|
Business and public service associate professionals |
8.3 |
6.3 |
7.4 |
7.4 |
7.0 |
7.8 |
8.7 |
11.4 |
8.8 |
7.4 |
7.5 |
7.4 |
7.2 |
|
Administrative occupations |
8.3 |
9.0 |
8.6 |
8.1 |
7.5 |
8.9 |
9.4 |
7.7 |
8.3 |
7.8 |
8.6 |
8.0 |
9.6 |
|
Corporate managers and directors |
7.9 |
5.5 |
7.2 |
7.4 |
7.6 |
7.7 |
8.4 |
9.7 |
9.3 |
7.8 |
6.6 |
5.9 |
5.6 |
|
Elementary administration and service occupations |
7.4 |
9.4 |
8.3 |
8.4 |
8.8 |
8.3 |
7.1 |
5.5 |
6.5 |
7.8 |
7.4 |
8.2 |
5.9 |
|
Caring personal service occupations |
7.2 |
8.6 |
7.1 |
7.9 |
8.2 |
8.1 |
6.5 |
5.4 |
7.3 |
7.1 |
8.3 |
7.4 |
7.4 |
|
Science, research, engineering and technology professionals |
7.0 |
4.8 |
6.7 |
6.0 |
6.2 |
6.1 |
6.9 |
8.9 |
8.2 |
6.8 |
4.9 |
7.4 |
7.1 |
|
Business, media and public service professionals |
6.5 |
4.3 |
5.8 |
5.7 |
4.4 |
5.3 |
5.9 |
11.2 |
6.5 |
6.2 |
5.5 |
6.2 |
6.0 |
|
Teaching and educational professionals |
5.2 |
5.4 |
4.9 |
5.1 |
5.1 |
5.6 |
5.1 |
5.2 |
5.5 |
4.6 |
5.3 |
5.2 |
5.5 |
|
Sales occupations |
5.0 |
6.5 |
5.7 |
5.0 |
5.5 |
4.5 |
4.6 |
3.7 |
4.6 |
5.9 |
5.5 |
5.5 |
6.5 |
Source: Annual population survey, regional employment by occupation July 2020-June 2021, accessed via nomis
If low pay in the sectors and occupations that employ large numbers of people across all regions and nations remain low paid is not tackled, communities will not feel that they have been levelled up.
Insecure work
Across the UK, 3.6 million people – one in nine of the workforce - are in insecure work[5]. The table below sets out the main categories of insecure work.
Who is in insecure work?
|
Zero-hours contract workers (excluding the self-employed and those falling |
876,800 |
|
Other insecure work - including agency, casual, seasonal and other workers, |
824,400 |
|
Low-paid self-employed (earning an hourly rate less than the minimum |
1.91m |
|
TUC estimate of insecure work |
3.6m |
|
Proportion in insecure work |
11% |
Source: Labour Force Survey and Family Resources Survey. The total number in ‘insecure work’ includes (1) agency, casual, seasonal and other workers, but not those on fixed – term contracts, (2) workers whose primary job is a zero-hours contract, (3) self-employed workers who are paid less than the minimum wage. See footnote 15 for more details.
These jobs are spread across sectors and are not limited to the digital economy. TUC analysis[6] shows that nearly one in four (23.1 per cent) of those in elementary occupations, including security guards, taxi drivers and shop assistants, are in insecure work. It is the same for more than one in five (21.1 per cent) of those who are process, plant and machine operatives. Very large numbers of those in the skilled trades and caring, leisure and other service roles are also in precarious employment.
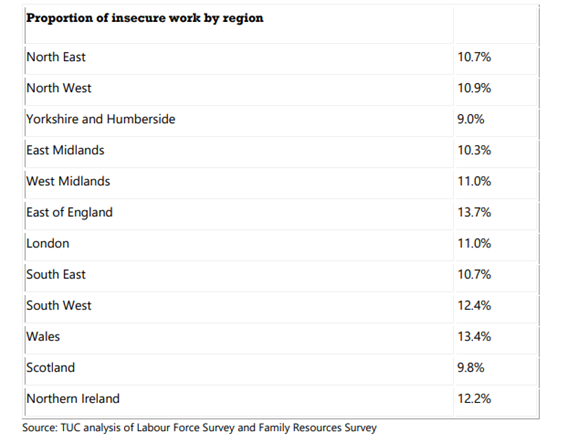
Like low pay, insecure work is endemic across every region and nation of the UK. Only Yorkshire and Humber and Scotland have less than one in ten workers in insecure work.
[1] IFS (2019) report ‘Catching up of falling behind? Geographical inequalities in the UK and how they have changed in recent years’ https://ifs.org.uk/uploads/Geographical-inequalities-in-the-UK-how-they-have-changed.pdf (see figure 6 on ‘within-region variation in residents’ mean full-time earnings)
[2] IPPR Analysis of Households Below Average Income 2017/18 – 2019/20 (data refers to the number of people in working families who are in relative household poverty)
[3] Living Wage Foundation (2020) Employee jobs paid below the living wage at https://www.livingwage.org.uk/sites/default/files/Nov%202020%20-Employee%20Jobs%20Paid%20Below%20the%20Living%20Wage%20LWF%20Report_0_0.pdf – this report covers employee jobs only, whereas the workforce data above covers all workforce jobs.
[4] Living Wage Foundation (2020) Employee jobs paid below the living wage at https://www.livingwage.org.uk/sites/default/files/Nov%202020%20-Employee%20Jobs%20Paid%20Below%20the%20Living%20Wage%20LWF%20Report_0_0.pdf – this report covers employee jobs only, whereas the workforce data above covers all jobs.
[5] The total number in ‘insecure work’ includes (1) agency, casual, seasonal and other workers, but not those on fixed – term contracts, (2) workers whose primary job is a zero-hours contract, (3) self-employed
workers who are paid less than the National Living Wage (£8.91). Data on temporary workers and zero-
hour workers is taken from the Labour Force Survey (Q4 2020). Double counting has been excluded. The
minimum wage for adults over 25 is currently £8.91 and is also known as the National Living Wage. The
number of working people aged 25 and over earning below £8.91 is 1,910,000 from a total of 4,000,000
self-employed workers in the UK. The figures come from analysis of data for 2019/20 (the most recent
available) in the Family Resources Survey and were commissioned by the TUC from Landman Economics.
The Family Resources Survey suggests that fewer people are self-employed than other data sources,
including the Labour Force Survey.
[6] TUC (11 July 2021) Jobs and recovery monitor – Insecure work https://www.tuc.org.uk/research-analysis/reports/jobs-and-recovery-monitor-insecure-work
[7] TUC, Living on the Edge: The rise of job insecurity in modern Britain, 2016 https://www.tuc.org.uk/research-analysis/reports/living-edge
Insecure work by region
Zero hours contracts have grown significantly in recent years – up from 70,000 in 2006[1] to the levels we see today. Recent polling for the TUC punctures the myth that these contracts offer two-way flexibility to both workers and employers. By far the most important reason respondents gave for taking zero-hours contract work was because that is the only work available. 45 per cent of respondents in a poll of 2,523 workers said that this was the most important reason for them being on zero hours contracts, while just 9 per cent cited work-life balance as the most important reason[2].
Insecure work both reflects and is deepening existing inequalities, with 14.1 per cent of BME workers in insecure work, compared to 10.7 per cent of white workers[3].
Many insecure jobs bear the characteristics of work that are linked by evidence to poor health outcomes, as discussed above in this report. Workers have reported that their medical appointments and social events often have to be cancelled at short notice[4]. Experiences of low levels of control and lack of peer and supervisor support are also borne out by our polling. A separate set of polling reveals that three quarters (75 per cent) of those in secure work would feel comfortable raising an issue with their manager, compared to 60 per cent of those in insecure work[5]. There is also a ten percentage point gap in the proportion of insecure and secure workers who feel safe at work, with 73 per cent of insecure workers feeling safe compared to 83 per cent of those in secure work[6].
Unfortunately, the pandemic seems to have created more uncertainty for insecure workers, not less, with a higher proportion of zero-hours workers in 2021 being offered work or having work cancelled at less than 24 hours' notice compared with 2017[7].
There is a broader pattern of employers seeking to distance themselves from those who work for them. Millions of people cannot enforce their employment rights with the “parent company” they ultimately work for because they work for outsourced companies or franchise businesses or are employed by recruitment agencies, umbrella companies and personal service companies.[8]
There is a particularly stark and growing issue for as many as half a million agency workers who are employed via umbrella companies. As well as facing problems asserting their rights and resolving workplace problems, they can also be the victim of complex wage arrangements that leaves them out-of-pocket and sometimes vulnerable to tax enforcement by HM Revenue & Customs[9].
There is an overlap between jobs that are low-paid and insecure – although as the data above shows, low pay is more extensive than insecurity. There are some geographical differences between the prevalence of each, with Yorkshire and Humberside having the lowest rate of insecure work but rating high in its share of low paid work. These differences will stem from differences in the sectoral and occupational composition of different areas. But despite some variations, the overall picture is that low pay and insecure work are both endemic across every region and nation in the UK.
And many jobs are both low paid and insecure, creating a double whammy for the quality of life of those who do them. The stress caused by the struggle to make ends meet compounded with uncertainty over shifts and pay, the difficulty in planning childcare, let alone a social life, create a toxic mix for those at the bottom end of our labour market.
We need a new approach to level up at work
Much industrial policy has aimed to redistribute better paid jobs more evenly across the country. The government has announced that a new Treasury office will be set up in Darlington, with around a quarter of Treasury staff moving to the new office; the new National Infrastructure Bank will be located in Leeds; and the government has announced plans to move 22,000 civil servants out of London by 2030. Other strategies – relating to skills, transport and other infrastructure policy – aim to make it easier to create and supply good quality jobs in areas that currently don’t have their fair share.
Creating a better distribution of high-skilled, high-paid jobs around the country is an important aim and if successful will improve opportunities for people in parts of the UK where good quality jobs are currently rare. It is a vital part of what is needed to level up. However, if it is not linked to strategies to improve the experience and rewards of low-quality work across all regions and nations of the UK, poverty and insecurity will remain endemic across the country. As well as creating new good quality jobs, we need to level up the jobs that people are already in.
The experience of London shows that the creation and existence of high-paid jobs in an area and does not automatically lead to rising incomes and a better quality of life for the wider community. Indeed, unless low-pay and poverty are also addressed, there is a danger that the creation of high-paid jobs will lead to deepening inequality, unaffordable housing and being priced out of local amenities for many local people. As the table above showed, London has the highest rate of in-work poverty in the country, with 21.8 per cent of people in poverty in a working household. The creation of good quality, green jobs is desperately needed – but it’s not enough on its own.
Levelling up must not replicate and extend the inequality of London. We need to create cohesive communities where every citizen is able to flourish and participate in economic and social life. This means tackling low pay and insecurity wherever they are found and levelling up at work across all regions and nations.
Inequalities: race, gender and disability
If levelling up is to mean everyone having the opportunity of a decent job, we need to tackle all forms of inequality that hold people back. We turn now to the structural inequalities facing black and minority ethnic (BME) workers, women and those with disabilities at work, which overlap with but goes beyond the issues of low pay and insecurity set out above.
The pandemic has highlighted the scale of the structural inequality we face and in many areas deepened it. It has made the case for change stronger than ever. In order to build back better, we need to build back fairer. Equality must be at the heart of any roadmap for levelling up.
[1] TUC, Living on the Edge: The rise of job insecurity in modern Britain, 2016 https://www.tuc.org.uk/research-analysis/reports/living-edge
[2] 2021 data: GQR Total sample n=2523, including oversamples of BME workers and people on Zero-Hours Contracts (ZHCs). Fieldwork: 29th January – 16th February 2021
[3] Statistics on insecure work are taken from Jobs and recovery monitor - Insecure work, TUC (2021). Available at: https://www.tuc.org.uk/research-analysis/reports/jobs-and-recovery-monitor-insecure-work
[4] TUC (2018) Living on the Edge, TUC p.35 https://www.tuc.org.uk/research-analysis/reports/living-edge-0
[5] Polling by BritainThinks for the TUC. All respondents working full / part time May 2021 (n=1972), Nov
2020 (n=2,182); = Insecure (n=110); Secure (n=1851). BritainThinks’ definition of insecure workers does not
include the self-employed.
[6] ibid
[7] 2021 data: GQR Total sample n=2523, including oversamples of BME workers and people on Zero-Hours Contracts (ZHCs). Fieldwork: 29th January – 16th February 2021
2017 data: GQR Research surveyed 300 workers on zero-hours contracts and 2987 other workers, all in Great Britain, online during August 2017. Results were weighted to the national profile of working people, by age, gender, ethnicity, full/part time contracts, public/private sector and industry. The zero-hours sample was separately weighted to national statistics for zero-hours workers, by gender, age, region, full/part-time hours and industry. A summary of the findings can be found here: https://www.tuc.org.uk/sites/default/files/great-jobs-with-guaranteed-hours_0.pdf
[8] TUC (2021) Shifting the risk https://www.tuc.org.uk/sites/default/files/Shifting%20the%20risk.pdf
[9] TUC (2021) Umbrella companies: Why agencies and employers should be banned from using them https://www.tuc.org.uk/research-analysis/reports/umbrella-companies-why… and Low Incomes Tax Reform Group (24 March 2021) Press release: LITRG report puts ‘umbrella’ companies under the spotlight 24 March 2021 https://www.litrg.org.uk/latest-news/news/210324-press-release-litrg-report-puts-umbrella-companies-under-spotlight
BME workers
The impact of coronavirus on BME people has shone a spotlight on multiple areas of systemic disadvantage and discrimination. There have been numerous reports produced over the years – some commissioned by the government itself – that have recommended action to tackle discrimination and entrenched disadvantage.
BME workers experience systemic inequalities across the labour market that mean they are more likely to be unemployed and are overrepresented in lower paid, insecure jobs, as set out in the previous section.
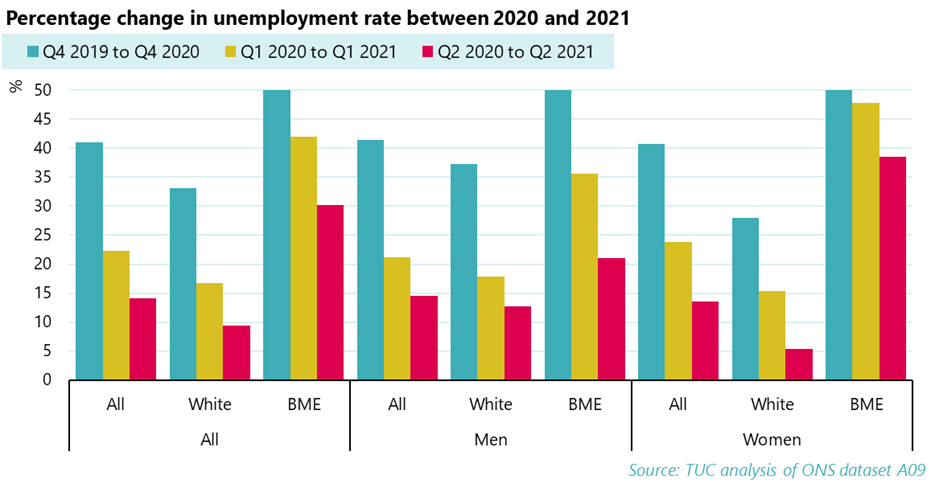
Since the current records began in 2001, the BME unemployment rate has never been less than 69 per cent higher than the white unemployment rate. As the table below shows, this has been worsened by the pandemic, which has had a disproportionate impact on BME unemployment, especially BME women. BME women have seen the starkest rise in unemployment since the start of the pandemic, with the unemployment rate for BME women reaching 10.9 per cent in Q4 2020.
These inequalities are compounded by the discrimination BME people face within workplaces. A poll of BME workers carried out on behalf of the TUC just before the pandemic found that nearly half (45 per cent) said they were given harder or less popular work tasks than their white colleagues[1]. A call for evidence launched by the TUC for BME workers to share their experiences of work during Covid-19 found that of over 1,200 respondents, one in five said they received unfair treatment because of their ethnicity.[2]
The Covid-19 crisis has shown us that this inequality not only limits Black people’s life opportunities through overrepresentation in poor quality work and high levels of unemployment, but also contributes to prematurely ending their lives. We need urgent action to address discrimination in the workplace and the overrepresentation of BME workers in jobs that are low paid and insecure.
Women
Female employees are more likely than male employees to be low-paid. Women make up 50 per cent of employees, but 59 per cent of employees who are paid below £10 per hour[3]. The gender pay gap is currently 15.5 per cent, meaning that the average female worker is paid 15.5 per cent less than the average male worker[4]. While this gap has been narrowing, at the current rate of change it will not close for another two decades.
The introduction of gender pay gap reporting in 2017 was a valuable step forward for women at work, bringing greater transparency to the enduring pay inequality experienced by women. The suspension of pay gap reporting in 2020 and the six-month delay in the requirement to report in 2021 sent a negative message to employers about the importance placed on equality for women in the workplace; equality should not be a side issue to be pushed aside in challenging times.
As TUC reports[5] have highlighted, the pandemic and the government’s response to it have had particular impacts on women, risking turning the clock back on decades of incremental progress.
The pandemic has revealed the fragility of the arrangements that enable mums to maintain employment. For many working mums, a balance of schooling, wraparound care, informal childcare support and annual leave enables them to balance work and care from family and friends with formal childcare and school holiday provision, accompanied by careful arranging of working hours for the adults in the household. In a TUC survey of working mums conducted before the 2021 summer holidays, one in eight respondents said they would have to take unpaid leave over the summer to manage childcare and the same proportion said they would have to reduce hours[6].
Women are almost twice as likely as men to be employed in a key worker occupation (45 per cent, compared to 26 per cent)[7]. Many of the largest key worker occupations have a large majority of female employees, including care workers and home carers, nurses, primary and nursery education teaching professionals and teaching assistants, over 80 per cent of whom are women.
However, as well as well as being more likely to be key workers, women are more likely to be low paid than male key workers. Over four in ten (41 per cent) of female key workers are paid less than £10 per hour, compared with around one in three (32 per cent) of male key workers.
We need action now to address the persistent under-payment of women in the labour market and to give working mums and dads the flexibility they need to balance work with their responsibilities as parents.
Disabled workers
Before the outbreak of the Covid-19 pandemic, disabled workers faced huge barriers getting into and staying in work, resulting in significant employment and pay gaps compared with non-disabled workers.
In 2019/20, the employment rate for disabled people was 53.7 per cent, compared to 82.0 per cent for non-disabled people - an employment gap of 28.4 percentage points[8]. This means that disabled workers are much more likely to be unemployed, with the unemployment rate for disabled people currently double that of those without disabilities (8.1% compared to 3.8%).
While the disability employment gap narrowed slightly in 2019/20, the disability pay gap was widening. In 2018/19, non-disabled workers earnt £1.65 (15.5 per cent) more per hour than disabled workers. In 2019/20, this increased to £2.10 (19.6 per cent). Disabled women face the biggest pay gap, being paid £3.68 an hour less than non-disabled men[9].
Disabled workers face significant difficulties in accessing reasonable adjustments in the workplace, despite the fact that all employers have a legal duty under the Equality Act 2010 to make reasonable adjustments to address any disadvantages that disabled workers face. The law recognises that to secure equality for disabled people work may need to be structured differently, support given, and barriers removed.
However, TUC research found that before the pandemic, over four in 10 (45 per cent) of disabled workers who asked for reasonable adjustments failed to get any or got only some of the reasonable adjustments they asked for[10]. And the difficulties disabled workers face accessing reasonable adjustments continued during the pandemic, with almost half (46 per cent) of those who requested them failing to get all or some of the reasonable adjustments they needed to work effectively. Both before and during the pandemic, over two in five disabled workers were not told by their employers why their request for adjustments had not been implemented (44 per cent before the pandemic, 41 per cent after)[11].
The pandemic, and the huge changes it has caused to our everyday lives, have exacerbated the barriers disabled people face. Not only have disabled people been disproportionately affected in terms of loss of life, with six in 10 Covid-19 related deaths being disabled people[12], but pre-existing workplace barriers have been accentuated by the pandemic. We need urgent action to address disability employment and pay gaps and ensure that disabled workers have access to the reasonable adjustments they need.
[1] Poll findings and call for evidence findings mentioned in this section are taken from Dying on the Job, TUC (2020). Available at: https://www.tuc.org.uk/research-analysis/reports/dying-job-racism-and-risk-work
[2] ibid
[3] A £10 minimum wage would benefit millions of key workers, TUC (2020). Available at: https://www.tuc.org.uk/research-analysis/reports/ps10-minimum-wage-would-benefit-millions-key-workers
[4] Gender pay gap in the UK: 2020, ONS (2020). Available at: https://www.ons.gov.uk/employmentandlabourmarket/peopleinwork/earningsandworkinghours/bulletins/genderpaygapintheuk/2020
[5] Working Mums: Paying the Price available at https://www.tuc.org.uk/sites/default/files/2021-04/WorkingMums.pdf
Forced Out: The cost of getting childcare wrong available at: www.tuc.org.uk/sites/default/files/2020-06/ForcedOut2.pdf
[6] Summer holiday childcare: no let up for working mums, TUC (2021). Available at: https://www.tuc.org.uk/research-analysis/reports/summer-holiday-childcare-no-let-working-mums
[7] A £10 minimum wage would benefit millions of key workers, TUC (2020). Available at: https://www.tuc.org.uk/research-analysis/reports/ps10-minimum-wage-would-benefit-millions-key-workers
[8] The disability pay gap and disability employment gap is calculated by a TUC analysis of Labour Force Survey statistics from 2019 Q3 and 4, and 2020 Q1 and Q2. More details can be found in Disability pay and employment gaps, TUC (2020). Available at: https://www.tuc.org.uk/research-analysis/reports/disability-pay-and-employment-gaps
[9] ibid
[10] Disabled workers’ experiences during the pandemic, TUC (2021). Available at: https://www.tuc.org.uk/research-analysis/reports/disabled-workers-experiences-during-pandemic
[11] Disabled workers’ experiences during the pandemic, TUC (2021). Available at: https://www.tuc.org.uk/research-analysis/reports/disabled-workers-experiences-during-pandemic
[12] ONS Updated estimates of coronavirus (COVID-19) related deaths by disability status, England: 24 January to 20 November 2020 https://www.ons.gov.uk/peoplepopulationandcommunity/birthsdeathsandmarriages/deaths/articles/coronaviruscovid19relateddeathsbydisabilitystatusenglandandwales/24januaryto20november2020#overview-of-covid-19-related-deaths-by-disability-status
Stay Updated
Want to hear about our latest news and blogs?
Sign up now to get it straight to your inbox
