UK manufacturing output and global demand
It follows a revival of activity across the world, with the World Bank reporting (also this week) “a broad-based cyclical global recovery is underway”. In fact, the UK performance is less good than most other EU countries. But the real question is, will it last?
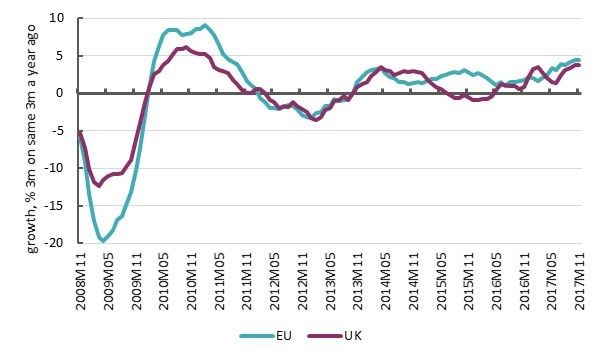
The best comparison is probably on an annual basis: comparing the latest three months (Sep-Nov 2017) with the same three months a year ago, UK manufacturing growth is 3.9% – the strongest since March 2011 – so for more than six years.
But we already know in terms of overall performance that UK GDP is lagging somewhat, with 2017 growth expected to be joint weakest (with Japan) of the main (G7) economies. UK manufacturing is up like the rest of the world, but still lags. The chart below compares the UK with the EU. Manufacturing annual growth for the EU28 is a little higher than the UK at 4.5%
Manufacturing, percentage annual growth
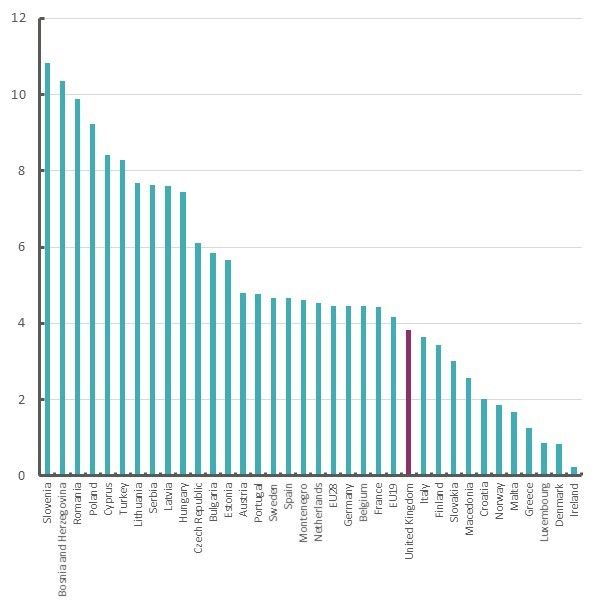
UK manufacturing growth is 23th of the 34 European countries for which ‘Eurostat’ report figures. Notably the strongest growing countries are broadly the less wealthy ones, but the UK is still lagging behind many like countries.
Manufacturing by EU country, percentage annual growth
Part of the revival appears to be related to what the OECD see as “improved momentum in the global IT cycle” (illustrated on the charts below).
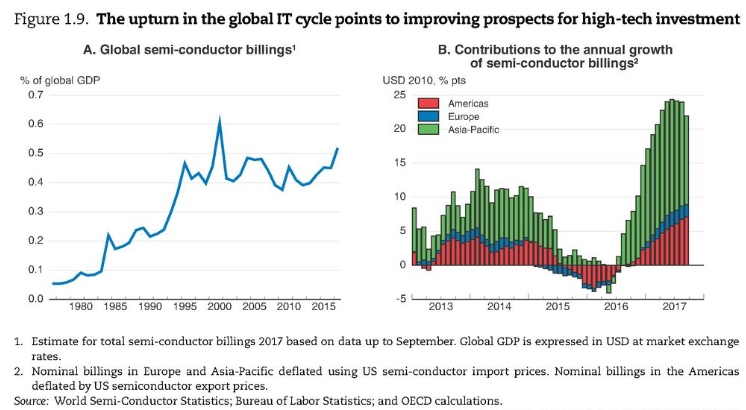
They speculate that businesses may be updating capital stock with new enhanced digital technologies, with potential benefits for productivity growth.
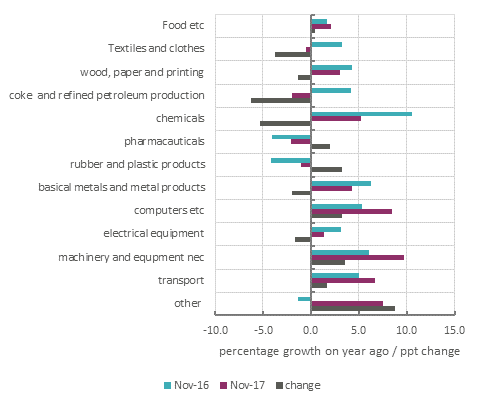
For the UK the ONS reported “broad-based growth” across industries; as the table below shows, computers (NB etc. = ‘and electrical and optical equipment’) is one of the strongest growing categories (transport is driven by a revival in motor vehicle production).
Manufacturing annual growth by industry
Global and industry trends suggest the recovery is driven by a revival in demand, both, specifically for tech investment on the part of firms, and more generally as a result of a revival in confidence. Interestingly, given EU growth is outstripping UK growth, the reduction in the sterling exchange rate may be making little difference to the overall performance.
Fundamentally the global expansion is likely to have been driven by expansionary policies. First many countries have cut back on the scale of austerity programmes, and many are now expanding. In November the OECD showed this summary of fiscal policy across advanced countries:
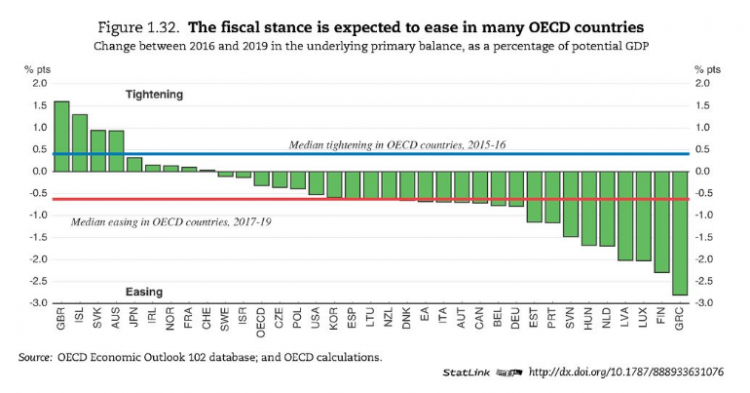
Note on this basis UK austerity over 2016-2019 is the most severe.
[NB the measure is an imperfect one, because the deficit (‘primary balance’ – i.e. the current balance excluding interest payments) is an outcome of policy: it might be possible for the measure to indicate easing when it just reflects deteriorating overall economic conditions.]
Second, there are the massively expansionary policies of central banks, with quantitative easing programmes in Japan and the EU (and also the more modest UK intervention in the wake of the referendum) over the past two years (here).
Importantly, the World Bank’s report is titled “Broad-Based Upturn, but for How Long?”. They discuss announced plans for (or actual) withdrawals of QE:
While a gradual and well-anticipated reversal of balance sheet policies should be manageable, unexpected changes, or market reassessment of these policies and of underlying inflation dynamics, could lead to an abrupt rise in global bond yields and risk premiums. In addition, uncertainty surrounding the outlook for inflation and equilibrium interest rates has contributed to diverging views between market participants and monetary authorities on the path for policy rates, particularly in the United States. A sudden market reassessment of this path could generate financial stress.
These withdrawals as well as tightening of monetary policies is now underway across much of the world (the UK story was discussed here). In the last few days commentators have observed Japanese QE coming to an end (here) and today the FT were reporting European Central Bank remarks suggesting the coming withdrawal of QE will proceed “faster than expected”.
To return to the UK. On Wednesday the Guardian’s ‘business live’ blog reported comments that are rather telling:
Samuel Tombs, chief UK economist at Pantheon Macroeconomics, points out that industrial production [i.e. manufacturing + energy] has grown now for eight consecutive months, making it the longest run of growth since May 1994.
If eight consecutive months is the best since 1994, then that speaks volumes for the overall performance since 1994. A broader perspective comes from projecting a December figure, and setting growth in 2017 against history. 2017 growth of 2.7% is the highest figure since 2014 (when 2.9%), and the fourth highest figure since the start of the 1990s.
Manufacturing output, annual growth
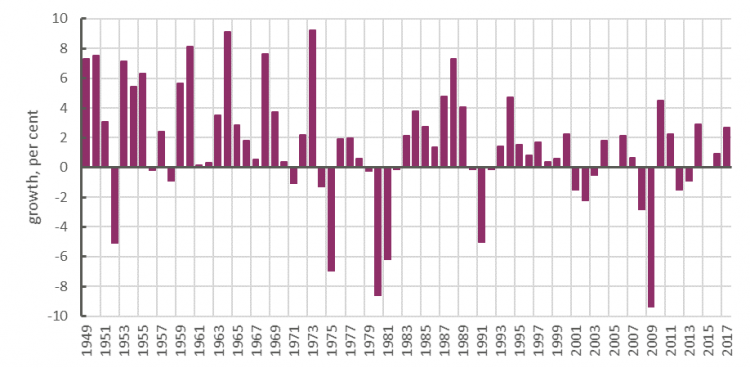
But we have had multiple false dawns over the same period. Really, since the ‘Lawson boom’ of the late 1980s, there has been very little doing – growth has averaged only 0.3% a year. For serious and sustainable (unlike Lawson) manufacturing advance, we have to look back to the period up to 1973, when growth averaged 3.5% a year.
Recent outcomes suggest that there is nothing wrong with the UK manufacturing industry if economic conditions are favourable (as car producers have also demonstrated). For decades manufacturers have had to cope with subdued but erratic conditions. Since the crisis, policymakers have not found a way to sustainable forward momentum. We can celebrate manufacturing for what might be. But until a new course is found, it won’t be.
Stay Updated
Want to hear about our latest news and blogs?
Sign up now to get it straight to your inbox