Pay in working class jobs
Millions of people in working class jobs have seen their pay flatline over the last decade. That's why we need a new deal for workers.
Download Pay in working class jobs report (pdf)
The Trades Union Congress was founded to advance the “general interests of the working classes”, and that remains our core mission today. While working class jobs may have changed with the shift to a service economy, the experience of poor pay, long hours, and class discrimination that the union movement has fought against remains all too common in today’s UK.
This note is the first in a series of TUC reports looking at the experience of today’s working classes. It shows that for most jobs, pay has been stagnant for almost a decade.
The seven million employees in jobs that earn less than median wages (£12.70 an hour in 2018) but aren’t in low paid jobs (defined here as 75 per cent of the median, or £9.60 an hour) have seen their pay flatline over the decade.
The minimum wage has helped push up pay at the very bottom – but without strong trade unions to ensure gains are widely shared, pay for those in jobs paid below the median is stagnating.
In contrast, those in the highest paid jobs, earning more than twice the median UK wage (over £26 an hour) have seen their pay packets increase by £1.26 an hour, a rise of four per cent, over the same period. For someone working a 35-hour week that would add up to a pay rise of £44 a week.
The analysis also shows how working-class jobs have changed; with retail and care workers now the largest occupations for those earning less than the median wage. And today’s working class is diverse. Looking at those in the worst paid jobs, both black and minority ethnic (BME) workers and women are overrepresented, whereas these groups are both under-represented amongst the higher earners.
Pay is just one aspect of work – and we know that many working-class people are experiencing increased insecurity, work intensification, including the use of new forms of surveillance and control at work, and a lack of voice. That’s why the TUC is campaigning for a new deal that gives working class people the power to bargain for the better jobs they deserve.
The Trades Union Congress was founded to advance the “general interests of the working classes” [1] , and that remains our core mission today. While working class jobs may have changed with the shift to a service economy, the experience of long hours, poor pay, and class discrimination that the union movement has fought against remains all too common in today’s UK.
This note is the first in a series of analyses looking at class in Britain today, and how the union movement can achieve its historic mission in the twenty-first century.
We know that there are many contested definitions of the term ‘working class’ itself. At its broadest, the term can mean everyone who works for a living – and we know (and show here) how workers have lost out in comparison to those who earn their money from owning capital.
A standard definition of class is based on an occupational analysis used by the Office for National Statistics (ONS), which typically categorises ‘working class’ jobs as those in ‘routine or semi-routine’ occupations. But we think this is too narrow a way to think of common working-class experiences; these jobs cover just 20 per cent of the working population, [2] whereas we know that around 60 per cent of people see themselves as working class.[3]
Instead here we look at class through the lens of both occupation and pay, looking at the experiences of people in jobs paid above and below the median, and at the low and high paid, as an approach to thinking about working class experiences today.
Class is about more than pay, and both within and outside work the experience of class encompasses issues of status and respect, control, and voice. We aim to try to capture more of these experiences in our future work.
In this note we look at:
- Pay in working class jobs
- Working class jobs today – and the types of occupations that are paid below the median
- Who’s doing working class jobs and working class diversity; and
- The new deal for working people we need.
[1] TUC, Our History: https://www.tuc.org.uk/about-the-tuc/our-history
[2] ONS (2019) Employment by socio-economic classification (EMP11)https://www.ons.gov.uk/employmentandlabourmarket/peopleinwork/employmentandemployeetypes/datasets/employmentbysocioeconomicclassificationemp11
[3] Geoffrey Evans and Jonathan Mellon (2016) ' Social Class Identity, awareness and political attitudes: why are we still working class?' at http://www.bsa.natcen.ac.uk/media/39094/bsa33_social-class_v5.pdf
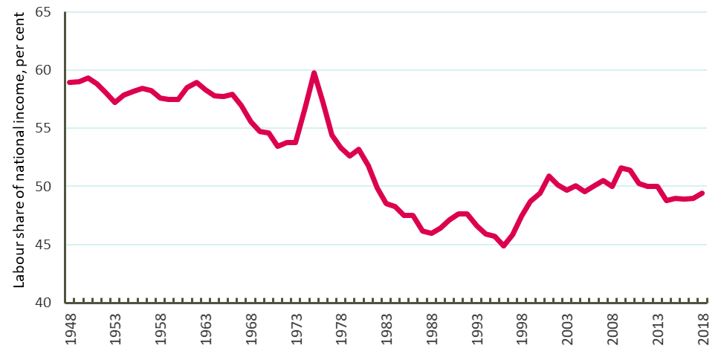
Looking at the broadest definition of ‘working class’, those who work for a living, we know that the share of national income going to labour has fallen since sustained highs in the post-war decades.
Data from the ONS show that the labour share of national income fell substantially during the 1980s, broadly flatlined since the turn of the century and has deteriorated a little under austerity.
Chart 1: labour share of national income since 1948
Looking within the pay distribution however shows that these losses haven’t been fairly shared.
Our analysis looks at median pay, depending on occupation, to find out how different types of jobs have been valued over time. The data, from the ONS Annual Survey of Hours and Earnings (ASHE), allows us to look back to 2002, and to compare the eight years to 2010 – the start of austerity – to the eight years after. [2]
We’ve broken down these occupations into four broad groups, to look enable us to look at changing trends. We also do a simple comparison between occupations paid above the median wage, and occupations paid below.
The table below sets out how we’ve defined these groups and some basic information about them.
[2] Data is from Annual Survey of Hours and Earnings (ASHE). Average pay for the occupations in the four broad groups has been weighted according to ASHE estimates of the number of employees working in each occupation. Data on the demographics of occupations, covered later in this report, is from the Labour Force Survey (LFS), and is an average of all quarters in the year has been taken.
|
Pay range in 2018 |
Number of people employed in 2018 |
|
|
Low earners Those in jobs earning below 75 per cent of the hourly median wage |
Below £9.60 an hour (around £17, 500 a year if working a 35-hour week [3] ) |
7.1 million |
|
Low -middle earners Those in jobs paid between 76 and 100 per cent of the hourly median wage |
Above £9.60 but below £12.70 an hour (Between around £17,500 and £23,260 a year if working a 35-hour week) |
7.7 million |
|
Below median Those in jobs paying below median wages |
Below £12.70 an hour (around £23,100 if working a 35-hour week) |
14.7 million |
|
Above median Those in jobs paying above median wages |
Above £12.70 an hour (around £23,100 if working a 35-hour week) |
12.7 million |
|
Middle-high earners Those in jobs paid above median but below twice the median hourly wage for all jobs |
Above £12.70 an hour but below £26 an hour (between around £23,100 and around £47,000 if working a 35-hour week) |
11.5 million |
|
High earners Those in jobs paid twice the median wage and above |
Over £26 an hour (over £47,000 if working a 35 hour week) |
1.2 million |
[3] In reality, working hours vary by occupation, and workers may have little choice over number of hours worked
Chart 2: Average hourly pay in jobs paid above and below median earnings, 2002-2018
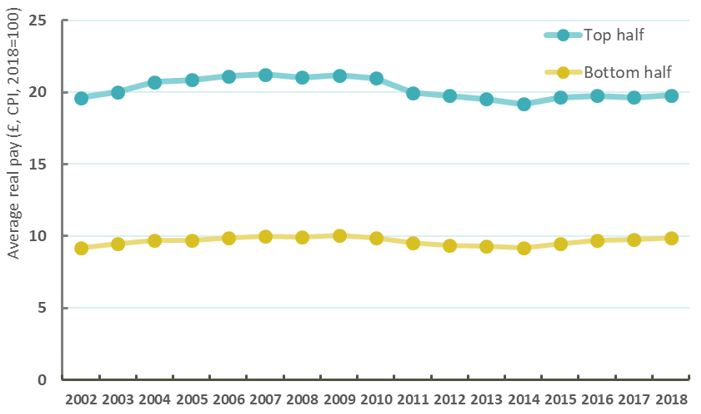
Chart 2 shows changes in average real pay in jobs above and below median pay since 2002. It shows that:
- Before 2010, pay grew at around the same rate in both the top and bottom half of the distribution; with pay growth of 7 per cent in the higher paid jobs, and 8 per cent in lower paid jobs.
- In cash terms, this meant higher pay rises for those in the top half – worth on average £1.37 an hour for the top half of earners, and £0.70 for those in the bottom half.
- After 2010, with the minimum wage protecting the bottom half of earners, the top half fared slightly worse. Between 2010 and 2018, real pay in jobs paid above the median fell by 6 per cent – worth £1.18 an hour. Real pay in jobs paid below the median stayed completely stagnant, the same now as it was back in 2010.
Chart 3: Average real hourly pay in jobs at various parts of the pay distribution, 2002-2018
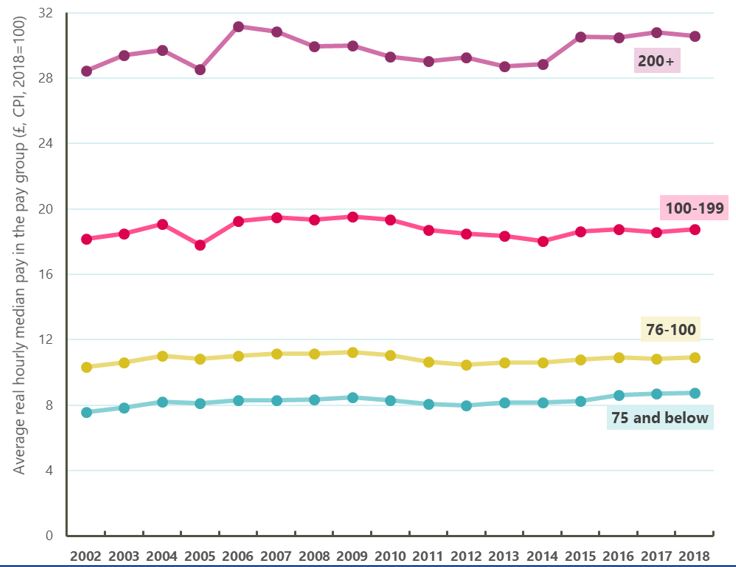
Chart 3 breaks this down further to look at the experience of different groups in the labour market, as set out above. It shows that:
- Prior to 2010, pay growth was fastest in percentage terms for the lowest paid jobs
- Pay for those in jobs paid less than 75 per cent of the median grew by 10 per cent (£0.76)
- Pay for those in jobs paid between 75 per cent and the median wage grew by 7 per cent (£0.73)
- Pay for those paid between the median and twice the median wage grew by 6 per cent (£1.16); and
- Pay for high earners – those paid twice the median wage grew by 4 per cent – though this was the largest in cash terms at £1.27.
- After 2010 both middle paid groups have seen their pay fall, with only the bottom and top paid groups seeing rises in pay.
- The lowest paid jobs have seen pay increase by 5 per cent (£0.43)
- Pay for low-middle earners has been basically stagnant – and is in fact now £0.14 below its 2010 level.
- Pay for jobs between the median and twice the median has also fallen – by 3 per cent, or 61 pence an hour.
- Pay for those jobs paid at twice the median wage has risen by 4 per cent – the largest cash rise again at £1.27.
So while all working people have suffered, only the lowest paid working class jobs have been protected by falls in pay by the minimum wage, while the best paid jobs have seen their pay rise again.
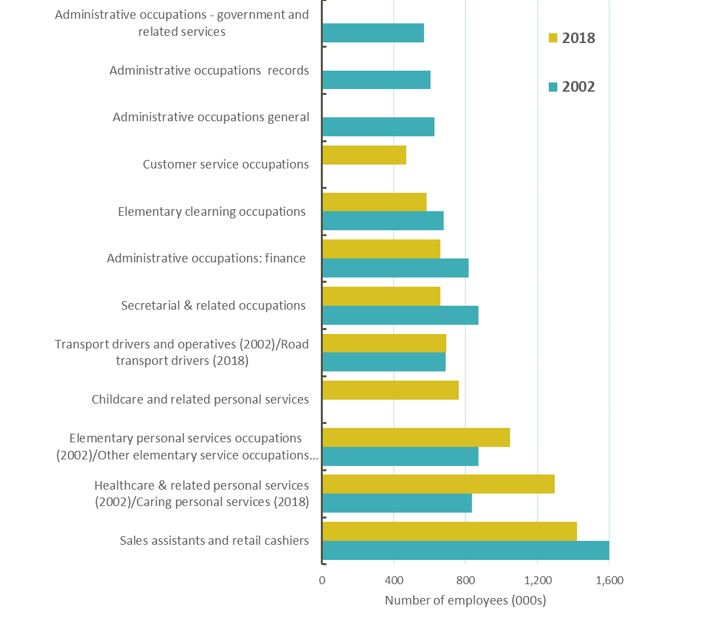
The shift to a service-based economy accelerated in the 1980s. In 1978, 63 per cent of jobs were in services. By 2002 (when the data we use for this report starts) that had risen to 80 per cent, and now stands at 85 per cent of all jobs. [3]
That’s reflected in the type of jobs most working class people are doing today. When we look at those paid below median earnings, the most common jobs are those in retail (1.4 million jobs) and those in caring personal services (1.3 million workers). Those were already common jobs in the lower half of the pay distribution in 2002 – but caring jobs have grown rapidly since then, overtaking secretarial jobs as the second most common type of lower paid job.
[3] ONS (June 2019) Employee Jobs by Industry (Jobs 03)
Chart 4: Top ten jobs in the lower half of the pay distribution, 2002 and 2018
Looking at the best paid employees, the type of jobs earning twice the median wage have also remained relatively constant. In 2018. 'chief executives' were the highest paid occupation, followed by ‘transport associate professionals’, 'functional managers and directors', 'senior officers in protective services', and 'legal professionals'. In 2002, the list was the same, except that 'transport associate professionals' were replaced by 'health professionals'.
Working class stereotypes often portray those in working class jobs as white and male. But we know that for decades, the working classes have been a highly diverse group – more so than those in the highest paid jobs.
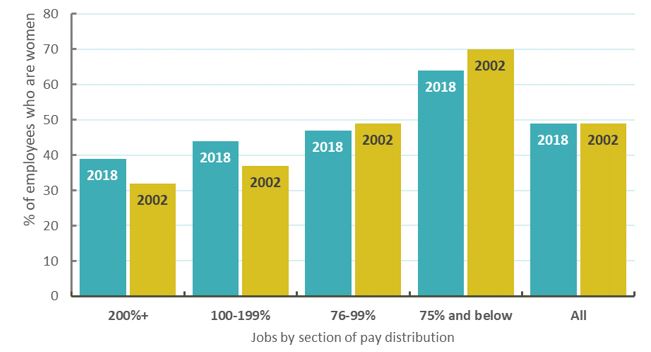
Chart 5: Women as a proportion of those in jobs across the pay distribution
Our analysis looked at race and gender. It shows that:
- Women still do most low paid jobs. Women still form the majority (55 per cent) of those in the bottom half of the pay distribution, and women are a significant majority of those in the lowest paid jobs – making up 64 per cent of those earning below 75 per cent of median pay.
- In contrast, women make up just 39 per cent of those in the highest paid jobs (and 43 per cent of those on above median pay). Overall, just under half of jobs (49 per cent) are done by women.
- There’s been some improvement since 2002, when women made up 70 per cent of those in the lowest paid jobs, and just 32 per cent of those in the highest paid, but access to high paid work is still clearly highly gendered.
Chart 6: BME employees as a proportion of those in jobs in different sections of the pay distribution
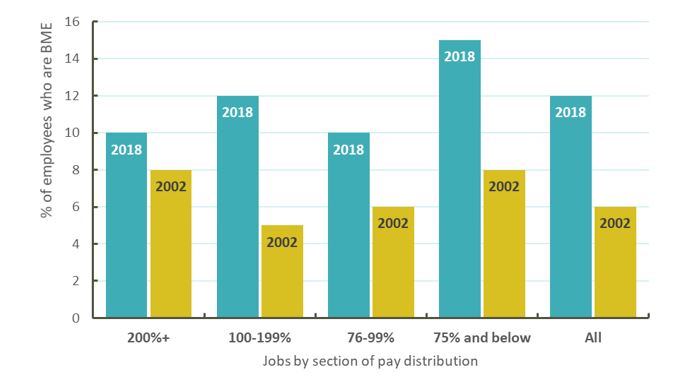
- Black and minority ethnic (BME) employees are over-represented in the lowest paid jobs. Looking at the whole bottom half of the pay distribution, BME employees do 12 per cent of all jobs – reflecting their share in the working population as a whole. But when we look at the lowest paid jobs, BME employees are over-represented, with 15 per cent of these jobs done by people from a BME background.
- BME employees are under-represented in the highest paid jobs, with just 10 per cent of workers in jobs paid twice the median wage coming from a BME background. As the population has become more diverse, BME employees' representation in the labour market overall has risen significantly; 12 per cent of all employees are now BME, up from 6 per cent in 2002.
This is the first of a series of reports looking at working class experiences in today’s labour market.
It shows that for too many people in working class jobs, the last decade has been one of pay stagnation.
We also know that job insecurity and work intensity have risen. TUC analysis shows that one in nine workers, 3.7 million people are now in insecure jobs.[5] And millions of people are putting in extra hours without getting paid - UK workers gave their employers £32 billion of free labour last year - a staggering total of two billion unpaid hours.[6]
We know that when workers are able to raise our voice in the workplace through our unions we can win better pay: the union pay premium is £1.14 per hour (8 per cent). That's one reason why trade union membership rose by 100,000 between 2017 and 2018.
But to make sure that working class people get the decent jobs and prospects they deserve we need a new deal for workers. We're calling for:
- The rate for the job and fair pay for everyone
- New rights so that workers can be protected by a union in every workplace, and when we use social media, so that nobody has to face their employer alone
- New rights for workers to bargain through our unions for fair pay and conditions across industries, ending the race to the bottom
- A £10 an hour national minimum wage and an end to discrimination against young workers
- Workers to be elected onto remuneration committees to help curb greed at the top
- Legal requirements on employers to report on and act to close race, gender and disability pay gaps
- Support for the genuinely self-employed while calling for a ban on zero hours contracts and false self-employment
- A right to reasonable notice of your shifts, and payment if your shifts are cancelled
- A move to a shorter working time with no loss of pay, starting with four new bank holidays a year, and setting an ambition for a four-day week
- A right to positive flexible working from day one of your job, with employers required to advertise all jobs on that basis
- A decent floor of rights for all workers and the return of protection from unfair dismissal to millions of working people.
[5] TUC (2019) Insecure work: Why the new PM must put decent work at the top of his to-do list https://www.tuc.org.uk/research-analysis/reports/insecure-work
Stay Updated
Want to hear about our latest news and blogs?
Sign up now to get it straight to your inbox
