Pay in working class jobs
The shift to a service-based economy accelerated in the 1980s. In 1978, 63 per cent of jobs were in services. By 2002 (when the data we use for this report starts) that had risen to 80 per cent, and now stands at 85 per cent of all jobs. [3]
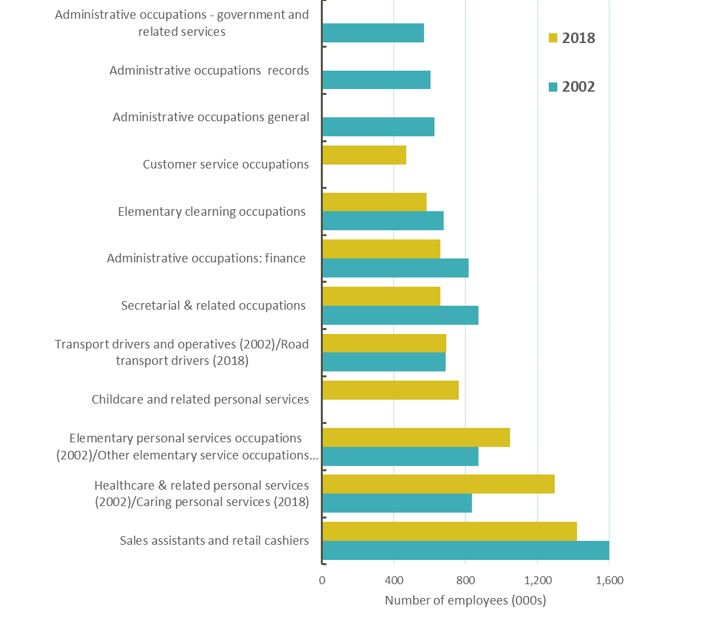
That’s reflected in the type of jobs most working class people are doing today. When we look at those paid below median earnings, the most common jobs are those in retail (1.4 million jobs) and those in caring personal services (1.3 million workers). Those were already common jobs in the lower half of the pay distribution in 2002 – but caring jobs have grown rapidly since then, overtaking secretarial jobs as the second most common type of lower paid job.
[3] ONS (June 2019) Employee Jobs by Industry (Jobs 03)
Chart 4: Top ten jobs in the lower half of the pay distribution, 2002 and 2018
Looking at the best paid employees, the type of jobs earning twice the median wage have also remained relatively constant. In 2018. 'chief executives' were the highest paid occupation, followed by ‘transport associate professionals’, 'functional managers and directors', 'senior officers in protective services', and 'legal professionals'. In 2002, the list was the same, except that 'transport associate professionals' were replaced by 'health professionals'.
Stay Updated
Want to hear about our latest news and blogs?
Sign up now to get it straight to your inbox
