A new deal: TUC statement on the spending review
After a decade of austerity, this one-year spending review and the subsequent budget and multi-year spending review that follow are crucial for the future of our public services.
From health and social care to prisons and schools, our members who deliver public services know that they are being stretched to breaking point. Cuts hurt everyone that relies on those services, but the most vulnerable are disproportionately impacted. Those that stand most to lose from a no-deal Brexit are the same communities that have lost most through the deterioration of their public services.
The Chancellor must act to undo the damage inflicted on services over the last ten years. Not just for one year but with a plan to invest in world class public services over the medium to long term. Not just ending cuts but reversing them, bringing investment back to the levels we need to maintain quality and meet demand. And while the TUC would support efforts to invest in our NHS, the government also needs to invest in the ‘unprotected’ areas like local government, criminal justice and social care that have suffered among the worst impacts of austerity.
The situation we face: Austerity continues
Research by the New Economics Foundation shows that, under current spending plans set out in the Spring Statement in March 2019, we can expect to see further real terms cuts of around 1.2 per cent per capita to 2022/23 outside of the protected areas like the NHS, defence and overseas aid[17].
[17] Austerity still biting unprotected departments, New Economics Foundation, March 2019
Despite the Government announcing the end of austerity in the Autumn budget of 2018, real terms cuts will continue and planned increases in spending are dwarfed by the scale of cuts to date. Under current spending plans, only one percentage point of lost ground will be recovered each year through to 2023/24 by which time real departmental spending will have been cut by 10 per cent or £500 per person[18].
Impact on services
A snapshot across a range of public services, shows the negative impact that the cuts have had on service users and communities.
Health
Despite real terms increases in spending, the spending settlements for the NHS in England have been much tighter in the 2010s than in the previous decades. This has had adverse impacts on service provision: for example, the number of patients on the waiting list for non-urgent treatment who were waiting over 18 weeks rose from 445,000 to 556,000 between December 2017 and December 2018 – the highest in 10 years [19].
Adult social care
Since 2009/10, 400k fewer older people received publicly funded social care and Age UK estimates that there are 1.4m people aged over 65 that do not receive the care and support they need with essential living activities [20].
Early years
Funding for Sure Start has been cut by two thirds since 2010 with the closure of 500 centres, 170 of which were in the poorest 30 per cent of neighbourhoods – despite analysis from the Institute for Fiscal Studies that has demonstrated the positive health and education benefits provided by government funded Sure Start centres, with benefits being “strongest for children in disadvantaged areas” [21].
Schools
Per pupil funding has been cut by 8 per cent in real terms since 2015 [22]. In that period, the number of pupils in state primary, secondary and special schools has increased by 315k, while the number of teachers has fallen by 3.5k. 13 per cent of pupils in primary and secondary schools are now taught in classes with over 30 pupils, the highest levels in over 15 years [23].
Prisons
Despite rises in recent years, the number of core operational staff in public prisons has declined by 15 per cent since 2009/10. Linked to this has been an alarming escalation in prison violence. In 2017/18 there were more than 9,000 assaults on prison staff, with the frequency of assaults almost tripled since 2009/10. The frequency of serious assaults against staff has risen even faster – from 289 in 2009/10 to 892 in 2017/18. There were 22,374 prisoner-on-prisoner assaults in 2017/18 – nearly double the number that took place in 2009/10 [24].
Local government and neighbourhood services
Neighbourhood services have seen spending cuts of up to 40 per cent, with severe outcomes in the most deprived authorities. APSE report that in the most deprived fifth of local authorities support for bus services is down by two thirds, spending on crime reduction, safety and CCTV down by a half, road safety and school crossings down by a third and food and water safety down by a quarter. APSE describe services “being dismantled … changing the very nature of local government” with worrying implications for too many abandoned communities around the country [25].
The number of libraries declined by 14 per cent between 2009/10 and 2016/17, with 34 per cent fewer library staff employed by local authorities. Over the same period, the number of councils providing weekly waste collection has reduced by 40 per cent. Between 2009/10 and 2016/17 the total number of annual health and safety visits carried out in Great Britain declined by 59 per cent [26].
This is backed up by the general public. Polling by Survation found that 42 per cent of the public perceived a decline in local services in their area, compared to just 16 per cent who said that services had improved.
Civil Service
While staffing numbers have begun to pick up since the EU referendum in 2016, civil service staffing is still down over 10 per cent from 2010 [61]. Staffing shortfalls continue to put stress on existing staff dealing with significant increase in demand, particularly under the impact of Brexit. The FDA’s Working Hours Survey showed that 91 per cent of members work over their contracted hours a week - with over a quarter working a full day’s unpaid overtime each week – more than two thirds of members had worked while on sick or annual leave and half of those surveyed were unable to take their full annual leave entitlement in the past 12 months. [62]
At the same time, the civil service continues to be subject to HM Treasury pay policy without the flexibilities offered elsewhere in parts of the public sector. Departmental guidance in the current year provides for a 1 per cent pay increase, extended to 2 per cent where departments are able to meet the cost, with no additional funding provided. Pay progression has been abolished and moving jobs has increasingly become the only way for civil servants to secure a decent pay rise.
The Institute for Government state that this partly explains the very high levels of staff turnover in the UK civil service, with some departments reporting over 25 per cent, that is hindering capacity and escalating costs across the civil service.[63]
[19] NHS England
[20]Key challenges facing social care sector in England, Kings Fund, September 2018
[21] The health effects of Sure Start, IFS, June 2019
[22] Institute for Fiscal Studies, July 2018
[23] Pupil Characteristics and Workforce Census, Department for Education, 2015 and 2018
[24] Performance Tracker, Institute for Government, October 2018
[25] Redefining neighbourhoods, beyond austerity, APSE, April 2017
A new approach; long term investment for decent public services
An end to further cuts is not, in itself, enough. For all our communities to benefit from an end to austerity, we need the government to commit to real terms funding increases in future years but also a restoration of funding lost since 2009/10 in order to address the deterioration in services, capacity and quality that is impacting on service users and the staff delivering them.
This will require significant investment and below we have set out some key areas to show the kind of funding that will be required to truly put an end to austerity and equip our public services to meet increasing demand and support communities facing an uncertain future. This is not an exhaustive list but illustrates the scale of the funding challenge that the government must address.
Public sector pay
In 2015, the TUC set out five tests for a fair pay deal for public sector workers, including funded increases, fair pay awards across all public services, freedom for collective bargaining and genuinely independent Pay Review Bodies, tackling low pay through the real Living Wage and the restoration of earnings lost since 2010.
Analysis carried out by the New Economics Foundation for the TUC set out the real-terms increases needed to departmental budgets over the next four-year period in order to fund fair pay rises. The research found that additional annual funding of £3.55bn will be needed next year to ensure pay rises of 1% above RPI inflation, rising to £10.6bn by 2022/23 for similar restorative rises each year[27].
|
Additional funding compared to baseline 2% rise: CPI inflation + 1% |
|
|
2020-21 |
£1.73 bn |
|
2021-22 |
£3.44 bn |
|
2022-23 |
£5.13 bn |
|
Additional funding compared to baseline 2% rise: RPI inflation plus 1% |
|
|
2020-21 |
£3.55 bn |
|
2021-22 |
£7.10 bn |
|
2022-23 |
£10.64 bn |
The figures represent the additional funding that would be required on top of an increase of 2% – the current average pay rise across the public sector. This would ensure that public sector pay rises both keep up with the cost of living and commence restoration of lost wages since the public sector pay cap was introduced in 2010.
Public sector workers are still earning significantly less in real terms than they were in 2010 – for example, TUC analysis shows that a teacher working outside of London is likely to be earning 12 per cent less in real terms than they were in 2010[27].
Pay restoration is essential not only out of fairness to public servants, whose wages have been pegged back for a decade, but also to address the growing recruitment and retention crisis across the public sector.
The research estimates that nearly half of this additional investment would be returned to the government in the form of direct taxes paid by public sector workers, reduced in-work benefits and indirect taxes through the growth stimulus in the wider economy.
Local government
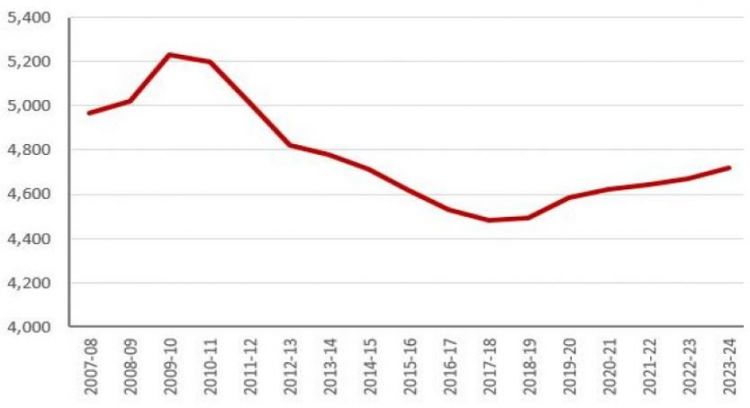
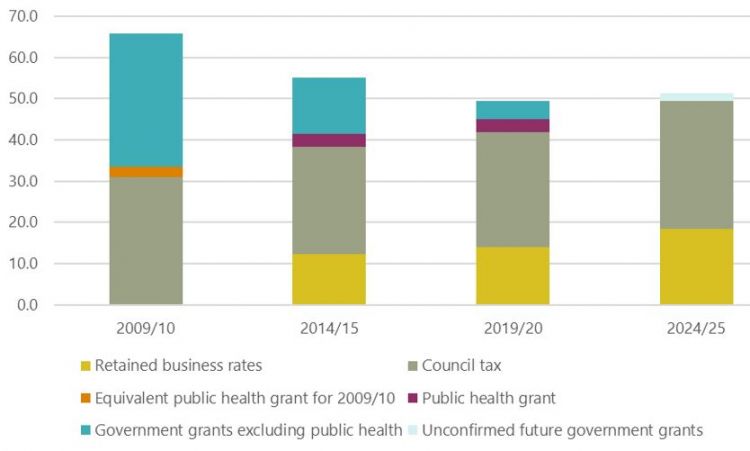
Local government has been particularly hard hit through austerity. Central government funding via the Ministry of Housing, Communities and Local Government fell by 86 per cent in real terms since 2009/10. While some of this was made up through greater retention of business rates, council tax increases and ring-fenced grants at the local level, this was insufficient to address the loss of central government funding so that core spending power of local authorities decreased significantly from 2009/10 to the present day. Furthermore, funding is currently set to flatline moving forward over the next 5 years, as the following chart shows.
Behind the aggregate figures there are significant regional variations, with those local authorities that were most grant-dependent, less equipped with assets and revenue raising capacity, including business rates base and with less reserves suffering disproportionately larger cuts.
While funding is set to increase marginally over the next 5 years, this will neither restore funding lost since 2010 and, perhaps more significantly, will fail to keep track with the increased demand resulting from a growing and ageing population, leading to a growing funding gap.
Research by the New Economics Foundation for the TUC estimates growth in demand for services, through tracking changes in key demographic groups, combined with increases in prices to calculate the cost of providing services at the same scale, access and quality as in 2009/10. This analysis shows a likely funding gap in 2019/20 of £19.3bn, rising to £25.5bn by 2024/25[29].
[29] New Economics Foundation, August 2019
Estimates of the funding gap between expected revenue and need, in terms of 2009/10 level service access and quality, in 2019/20 and 2024/24 (£ billion, 2019-20 prices)
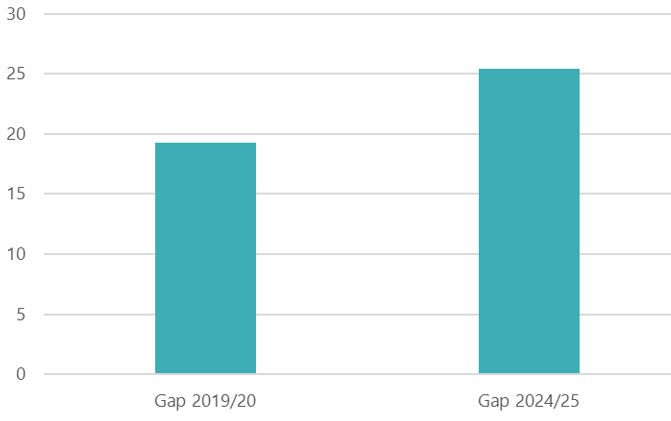
To meet rising demand and maintain quality services, local authorities will need an additional 51 per cent funding on top of current projections.
School funding
Research undertaken on behalf of the National Education Union, The Association of School and College Leaders, the National Association of Headteachers and the cross-party F40 group of lowest-funded local authorities has calculated the funding required to restore pupil funding to 2015/16 levels while meeting school cost pressures going forward.
Using government figures, they employed a cost index covering schools and early years, including pay, pension, national insurance, national minimum wage, apprenticeship levy and non-staff spending, uprated by inflation to calculate funding requirements over the next four years.
They found that an additional £12.6bn would be required by 2022/23, set out in the following table[30].
|
Actual funding for 2019/20 |
Necessary funding by 2022/23 |
Additional funding by 2022/23 |
|
|
Schools & Central Services block |
£36.08bn |
£41.86bn |
£5.79bn |
|
High needs |
£6.33bn |
£9.45bn |
£3.12bn |
|
Early Years |
£3.54bn |
£4.11bn |
£0.57bn |
|
Pupil premium |
£2.42bn |
£2.98bn |
£0.57bn |
|
16 - 19 |
£5.67bn |
£8.26bn |
£2.59bn |
|
Total revenue |
£54.04bn |
£66.67bn |
£12.63bn |
In addition, in their report The True Cost of Education, the Association of School and College Leaders carried out its own analysis, in which it proposes an additional investment of £5.4bn over the following two years, from 2023/24 to 2024/25, to meet the basic expectation on schools and ensure that every child is taught by a qualified teacher in classes of no more than 30 pupils.
The organisations involved have set out an implementation schedule, starting with an immediate £3bn injection in the current year, followed by increases as follows:
|
Year |
Phased increase in revenue funding to cancel cuts and then fund basic entitlement |
Additional funding required on actual 2019/20 allocation (£54.04bn) |
|
2019-20 |
£57.04bn |
£3.00bn |
|
2020-21 |
£60.41bn |
£6.37bn |
|
2021-22 |
£63.75bn |
£9.71bn |
|
2022-23 |
£66.67bn |
£12.63bn |
|
2023-24 |
£70.79bn |
£16.75bn |
|
2024-25 |
£75.14bn |
£21.11bn |
[30] NEU, NAHT, ASCL, F40, July 2018
Stay Updated
Want to hear about our latest news and blogs?
Sign up now to get it straight to your inbox