Weakest GDP growth for 5 years driven by slowdown in services output
The first formal estimate for calendar year 2017 is for growth of 1.8%, down on 1.9% last year and the lowest growth since 1.5% in 2012.
Manufacturing saw a better year, but these gains were more than outstripped by the weakest services growth for six years.
GDP growth and industry contributions
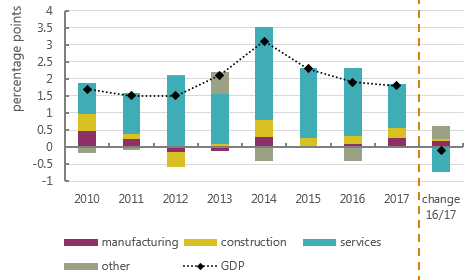
The chart shows GDP growth in 2017 still dominated by service sector activity, but the contribution down by 0.7 percentage points (ppts) on 2016 (last column, blue bit). While manufacturing makes a relatively small contribution to GDP overall, the contribution increased by 0.2 ppts on the year. The positive contribution of construction was up by 0.1 ppts. ‘Other’ was seemingly mainly driven by the adjustments that ONS use to keep the industry-based measure in line with a broader view derived from the expenditure and income measures (though the Q4 data for these are not yet available).
In terms of growth rates, manufacturing grew by 2.7% in 2017, the strongest growth since 2014 (when 2.9%). This seems to reflect both a stronger global economy, and a particular surge in activity in high-tech areas (see here for broader discussion).
Construction growth was up on the year, to 5.1% from 3.9%. However, the year was very much a game of two halves, with strong increases at the start of the year giving way to reduced activity later on.
But the big concern is services. Calendar year growth of 1.6% was the lowest since 2011 (when 1.5%). And the weakness was across the board:
- retailing and distribution growth was down to 2.1% in 2017 from 4.7% in 2016
- transport and communications down to 2.7% from 4.7%
- businesses and finance down to 1.8% from 2.2%
- and government and other unsurprisingly still stagnating at 0.4%, down from 0.6%.
There is a sense of domestic fragility, with the only respite coming from the ongoing revival in global activity.
But even the IMF and World Bank are relatively cautious about global prospects going forward. At home, ongoing austerity and the threat of further interest rate rises remains a worrying combination.
As Frances O’Grady argues, in her comment on the GDP figures:
Stay Updated
Want to hear about our latest news and blogs?
Sign up now to get it straight to your inbox


