Jobs and recovery monitor - BME Workers 2023
BME workers face systemic disadvantage and discrimination in the labour market, whether it be lower employment rates and higher unemployment rates, lower pay, more insecure work, or occupational segregation.
The consequences of these inequalities were all too clear during the pandemic when many BME workers found themselves working more dangerous jobs and dying at higher rates than white workers.[1] Systemic inequalities mean BME workers are over-represented in insecure and lower paid jobs. Many BME workers had little choice but to put themselves in harm’s way.
Of the many inequalities BME workers face, pay is a critical one. But recording of data on this is poor. Headline official pay statistics do not record ethnicity, and no employers are mandated to record and publish their ethnicity pay gaps. This must be fixed to identify the causes and close the gaps faced by BME workers.
The TUC is calling for an end to the structural discrimination and inequalities that hold BME people back at work. This includes:
- Including ethnicity in flagship official pay statistics. Official statistics are inadequate when it comes to pay and ethnicity. The available sources of data are not timely, accessible, or reliable enough. The ONS must take action to record ethnicity in its flagship pay statistics such as AWE and ASHE.
- Introducing mandatory ethnicity pay gap reporting. Business and unions are united in their support for compulsory ethnicity pay gap monitoring. Alongside publishing the raw data, every employer must publish an action plan setting out how they will close their pay gap and ensure pay parity between Black and white workers.
- Getting rid of insecure work. BME workers are significantly more likely to experience insecure and poor-quality work. Raising the floor of rights for everyone – by, for example, banning zero-hours contracts – will disproportionately benefit BME workers. Reversing outsourcing, introducing fair pay agreements across the economy and giving workers the right to access their union on-site would also improve rights for all.
Other in-depth recommendations are set out in the TUC’s “Dying on the Job” (2020) report.
[1] Dying on the job – Racism and risk at work, TUC (2020), https://www.tuc.org.uk/research-analysis/reports/dying-job-racism-and-r…
Unemployment
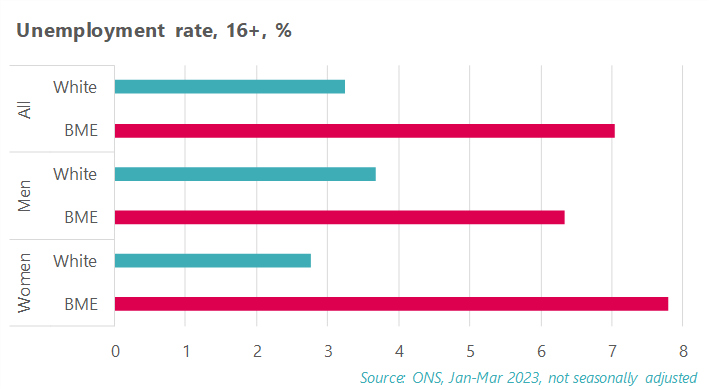
BME workers are more than twice (2.2 times) as likely as white workers to face unemployment. The BME unemployment rate currently stands at 7.0 per cent compared to 3.2 per cent for white workers.
BME women face an even bigger penalty with an unemployment rate almost three (2.8) times higher than white women. The unemployment rate for BME women is 7.8 per cent compared to 2.8 per cent for white women. Worryingly, this gap has been widening. It is up from 2008 when BME women faced unemployment rates 2.3 times worse than white women.
BME men face an unemployment rate of 6.3 per cent compared to 3.7 per cent for white men.
Employment
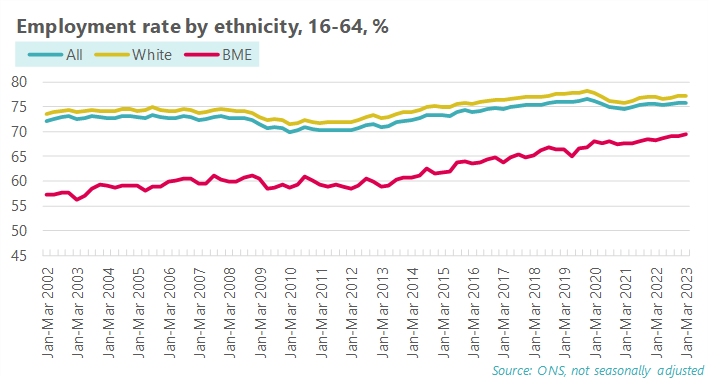
The employment rate is 7.8 percentage points lower for BME workers than white workers. This gap remains despite increases in BME employment over the last 20 years. BME workers have an employment rate of 69.4 per cent compared to 77.2 per cent for white workers in Jan-Mar 2023. This is an improvement from employment rates of 57.3 per cent and 73.4 per cent respectively in Jan-Mar 2002, when comparable records began. But it would take approximately two more decades to close the employment rate gap at this pace.
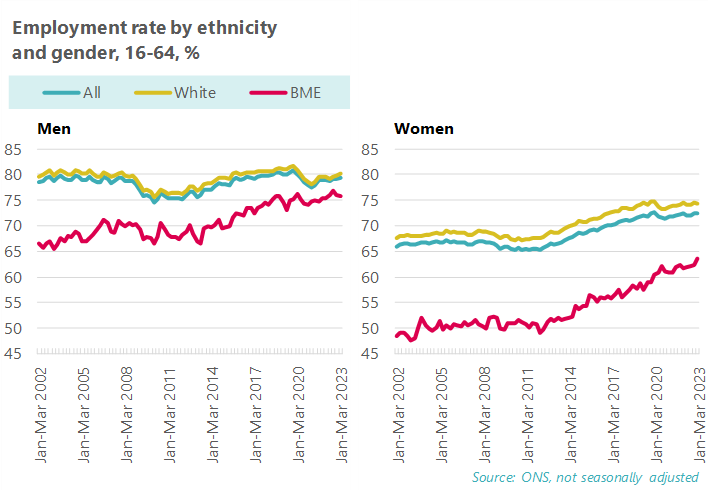
BME women face significantly lower employer rates than other workers at just 63.6 per cent in Jan-Mar 2023. This has risen from 49.7 per cent in Jan-Mar 2002, but the gap remains large. Current employment rates are 74.2 per cent for white women and 80.1 per cent for white men. BME men have an employment rate of 75.7 per cent.
Economic inactivity
There has been a lot of focus on the overall increase in labour market inactivity rates since the pandemic started.2 . Over the medium-term, inactivity has been declining for BME workers and this has continued despite an uptick in inactivity for white workers.
- 2 Creating a healthy labour marker, TUC (2023), https://www.tuc.org.uk/research-analysis/reports/creating-healthy-labou…
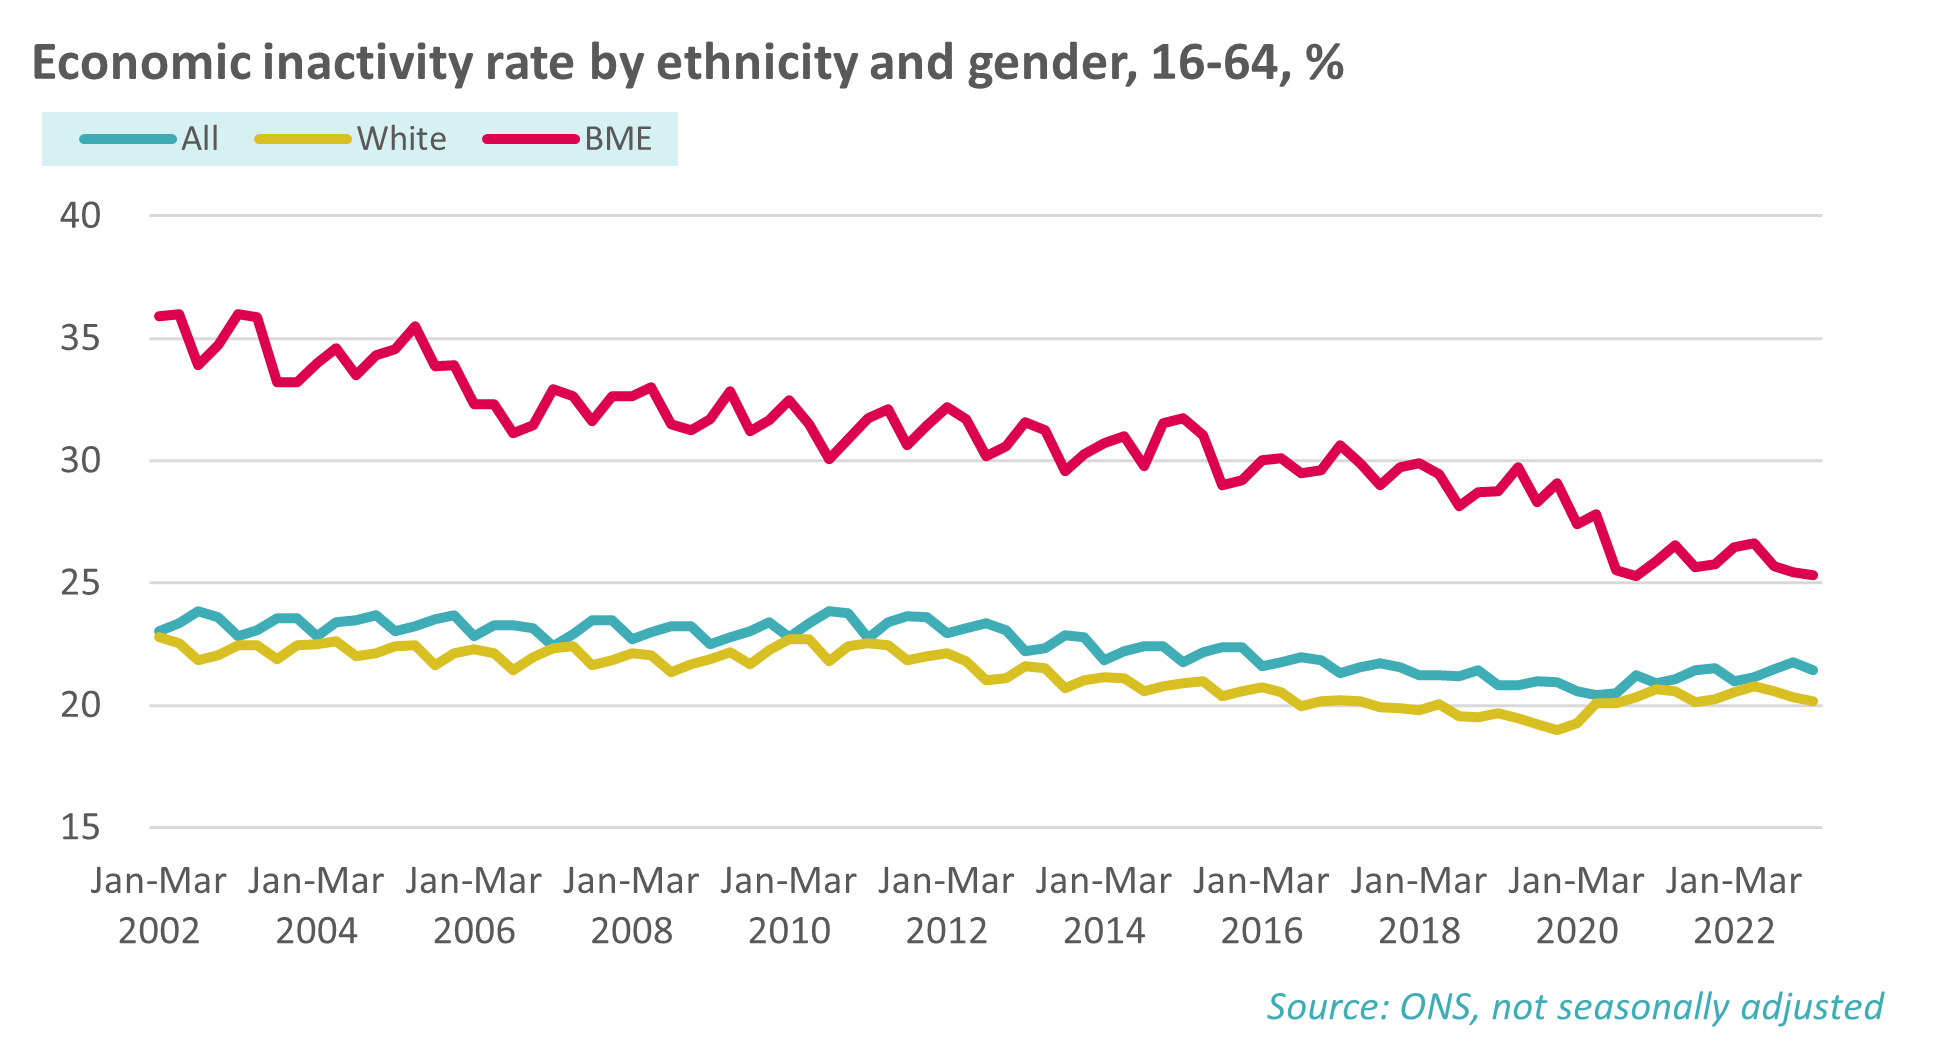
The inactivity rate for BME people is still 5.1 percentage points higher than for white people, despite this gap steadily shrinking since records began. Roughly 25 per cent of BME people are currently economically inactive. This includes 31 per cent of BME women, compared to 20 per cent of white people, and 24 per cent of white women.
Young BME workers
The youth unemployment rate for young BME workers stands at 19.2 per cent, compared to 8.8 per cent for young white workers. This tells us that BME young people who choose to work, rather than study, have a more difficult time in the labour market than their white peers.
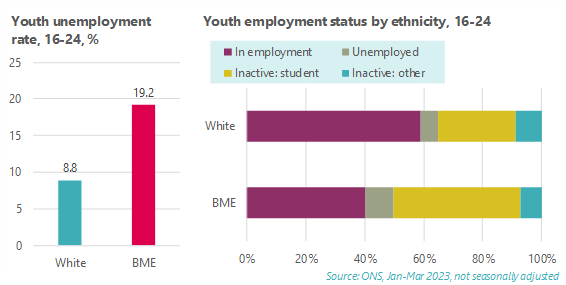
The youth unemployment rate does not tell the whole story. Unemployment rates are calculated by finding the number of people unemployed as a percentage of those who are economically active (which is the number of people employed plus the number of people actively seeking and available to work). This exclude students who are outside the labour market.
The above chart shows that BME young people, aged 16-24, are much more likely to be studying while inactive in the labour market. Currently, 43 per cent of BME young people are studying rather than working, compared to 23 per cent of young white people. More participation in education is positive, but it remains a concern that BME workers are more likely to be unemployed at every qualification level.
Pay
Official statistics are inadequate when it comes to pay and ethnicity pay gaps. The two main sources of pay data from the ONS do not record ethnicity. These are the Annual Survey of Hours and Earnings (ASHE) and Average Weekly Earnings (AWE). Instead, we are left to rely on the Labour Force Survey and Annual Population Survey which have lower quality earnings data.
The ONS has published reports on ethnicity pay gaps but the most recent one was published in 2020.3
This publication shows a raw gap of 2.3 per cent in 2019, with a median hourly wage of £12.11 for BME workers compared to £12.40 for white workers. Longhi and Brynin (2017) have produced more in-depth work highlighting ethnicity pay gaps over a few years using the same data sources.4
This shows that there are significant gaps between white and BME workers, but the longer timeframe inevitably makes it less responsive to recent shifts.
In our view the available sources of data are not timely, accessible or reliable enough. The government must improve official statistics and mandate employers to record and publish ethnicity pay gaps alongside gender pay gap statistics.
Occupation
Occupational segregation plays a significant role in the systemic disadvantages faced by BME workers in the labour market. BME workers are over-represented in the three lowest paid occupational categories in the labour market.
- 3 Ethnicity pay gaps: 2019, ONS (2020), https://www.ons.gov.uk/employmentandlabourmarket/peopleinwork/earningsa…
- 4 The ethnicity pay gap, EHRC, Longhi and Brynin (2017), https://www.equalityhumanrights.com/en/publication-download/research-re…
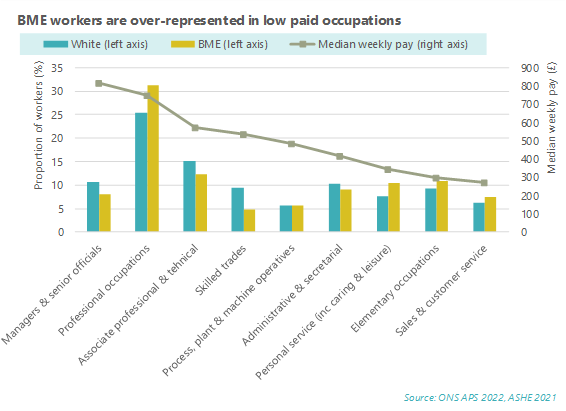
This includes sales and customer service occupations, which employs 7.5 per cent of BME workers compared to 6.3 per cent of white workers. Median weekly pay is just £274 an hour according to the latest ASHE figures.
It also includes elementary occupations which are defined as those that generally only require the level of qualifications achieved at the end of compulsory education. These occupations employ 10.9 per cent of BME workers compared to 9.3 per cent of white workers. Median weekly pay is just £295.
Finally, BME workers are over-represented in personal service occupations in sectors such as caring. These occupations employ 10.5 per cent of BME workers compared to 7.7 per cent of white workers. Median weekly pay is £341.90.
Higher paying occupations such as managers, associate professionals and skilled trades all have an under-representation of BME workers. The exception here is professional occupations which are well paid and have a higher instance of BME workers.
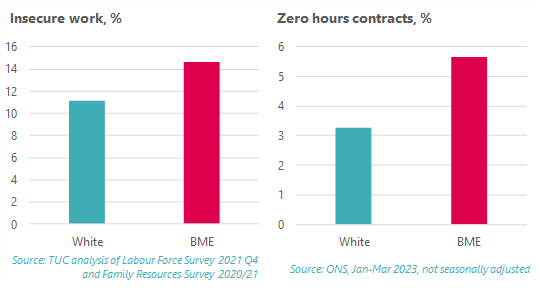
TUC analysis of official data shows that BME workers are far more likely than white workers to be in insecure work. Our analysis found that in 2021 one in six (14.6 per cent) BME workers were in insecure work. This is far ahead of the 11.1 per cent of white workers who were in the same position. This analysis includes those on zero-hours contracts, agency, casual and seasonal workers, and low paid self-employment.
Looking just at zero-hours contracts, recent official statistics show that BME workers are far more likely to be on this type of insecure contract. 5.6 per cent of BME workers are on zero-hours contracts compared to 3.3 per cent of white workers,
The TUC will be publishing new updated analysis on the extent of insecure work in the coming months. This will include breakdowns by ethnicity.
Recommendations
The TUC is calling for an end to the structural discrimination and inequalities that hold BME people back at work. This includes:
Including ethnicity in flagship official pay statistics. Official statistics are inadequate when it comes to pay and ethnicity. The available sources of data are not timely, accessible, or reliable enough. The ONS must take action to record ethnicity in its flagship pay statistics such as AWE and ASHE.
Introducing mandatory ethnicity pay gap reporting. Business and unions are united in their support for compulsory ethnicity pay gap monitoring. Alongside publishing the raw data, every employer must publish an action plan setting out how they will close their pay gap and ensure pay parity between Black and white workers.
Getting rid of insecure work. BME workers are significantly more likely to experience insecure and poor-quality work. Raising the floor of rights for everyone – by, for example, banning zero-hours contracts – will disproportionately benefit BME workers. Reversing outsourcing, introducing fair pay agreements across the economy and giving workers the right to access their union on-site would also improve rights for all.
Other in-depth recommendations are set out in the TUC’s “Dying on the Job” (2020) report.
Stay Updated
Want to hear about our latest news and blogs?
Sign up now to get it straight to your inbox