
The labour market is in the danger zone
The latest labour market data has been warmly received by the government. The Chancellor, Jeremy Hunt, put a positive spin on the data, claiming to be heartened by the figures.
But employment is falling and unemployment is rising. The high pay growth heralded by the chancellor comes with some hefty caveats. The reality is that the latest data should concern us. There are clear warning signs of a labour market in trouble.
Heavy caveats on some tepid pay data
Before we get in to discussions on pay growth, a quick explainer on the difference between nominal and real pay growth:
- Nominal pay growth is the change in pay before you factor in inflation. So if you got paid £500 per week in July last year, and it was up to £550 in July this year, that’s nominal pay growth of 10 per cent
- Real pay growth is just the same thing but factoring in inflation. So if inflation was also 10 per cent across the past year, that makes your real pay growth 0 per cent
And it’s worth noting that the most recent data covers May-July 2023. Data is averaged across three-month periods to make it more reliable.
The most recent labour market data shows that real pay growth is currently flat, with real average weekly earnings growing by 0.0 per cent over the past year. We use CPI inflation and current day prices to calculate real wages, which is why we get slightly different figures to the ONS, who use CPIH and 2015 prices.
Coming after twenty consecutive months of real pay falls, stagnant pay feels like good news. But there’s quite a few caveats that have to come with it.
The bigger picture on pay
Firstly, flat real wage growth may seem good compared to what we’ve seen over the past two years, but it’s weak by any other standard. Between 2000, when the current pay records began, and 2008, when the financial crisis hit, real wages typically grew by 2.3 per cent a year.
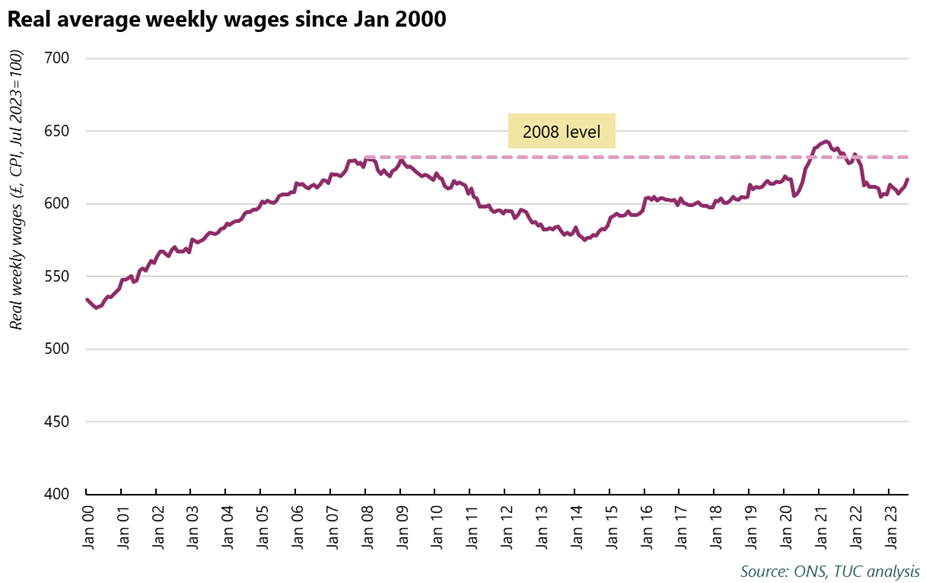
This speaks to the bigger pay crisis that’s been happening since 2008. In the eight years between January 2000 and January 2008, weekly real wages grew by £98 (18 per cent).
In the fifteen years since January 2008, real weekly wages have fallen by £15 (2.4 per cent). If real wages had instead grown at the average pre-2008 rate over this time, they’d now be £900 per week - £283 higher than they actually are.
Secondly, the headline figure masks some major disparities in real wage growth. Only one sector has experienced real pay growth since 2008: finance and business. The same sector is also currently experiencing the highest pay growth compared to the same period last year.
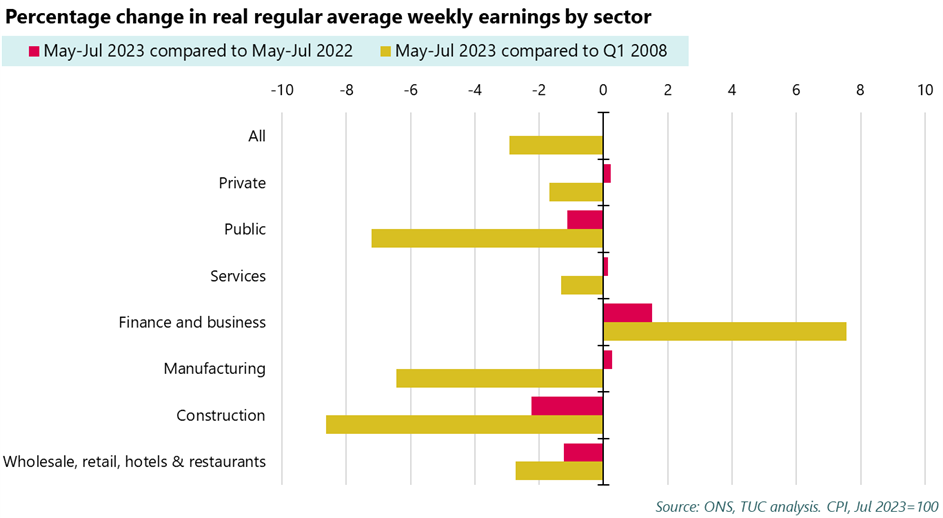
The chart above shows real pay growth over the past year (the red bars) and since the start of 2008 (the gold bars), broken down by sector. In last month’s data, finance and business was the only sector showing positive real wage growth over the past year. But we now see some very small positive real wage growth in services and manufacturing, as well as the private sector as a whole. It’s important to note here, again, that in all sectors except finance, real wages are below 2008 levels.
Real pay in the public sector is still falling. This is concerning as nominal pay growth in the public sector (6.6 per cent) is the highest it’s been since current records began in 2000. This is due to the pay deals won by public sector unions that have come into effect in June and July. Yet even with this record high nominal pay growth, real pay growth in May-Jul 2023 was outstripped by inflation.
The final caveat to the pay data is that we’ve been here before. As the chart below shows, there’s been a fair few false dawns since 2008, where it looked like the recovery was coming but it failed to last. For a brief moment in 2021, we actually did return to 2008 pay levels. However, the ONS was clear: this was due to so many low-paid workers losing their jobs during the pandemic that it skewed the pay data. A data blip due to job losses isn’t the pay recovery we want.
How do we get consistent pay growth?
So how do we get consistent real growth that lasts? In his response to the data, the chancellor explains that that lowering inflation is the key to getting sustainable real pay growth. There’s some truth in this, but it’s not the whole story.
We had low inflation for much of the 2010s, yet real pay still regularly fell, partly due to the government’s own decision to repeatedly impose public sector pay freezes and caps. Even if inflation is at 2 per cent, we need to see regular nominal pay growth of over 4 per cent. And we need to see this across all sectors of the economy. To get this, we need a credible economic plan to deliver good jobs across the country, with stronger protections for workers and higher investment across public services and green infrastructure.
Rising unemployment
Pay shouldn’t be the Chancellor’s only concern. Despite his positive take on the employment statistics, the reality is that unemployment has leapt from 3.6 per cent to 4.3 per cent over the past year. That equates to around a quarter of a million (240k) more people out of work and is a worrying leap. Worryingly, around two-thirds of this increase was accounted for by workers aged 18-24 (+164k).
The number of people in employment is up on the same time last year, but down on the previous quarter (-207k) - the largest quarterly fall on record outside of a recession.
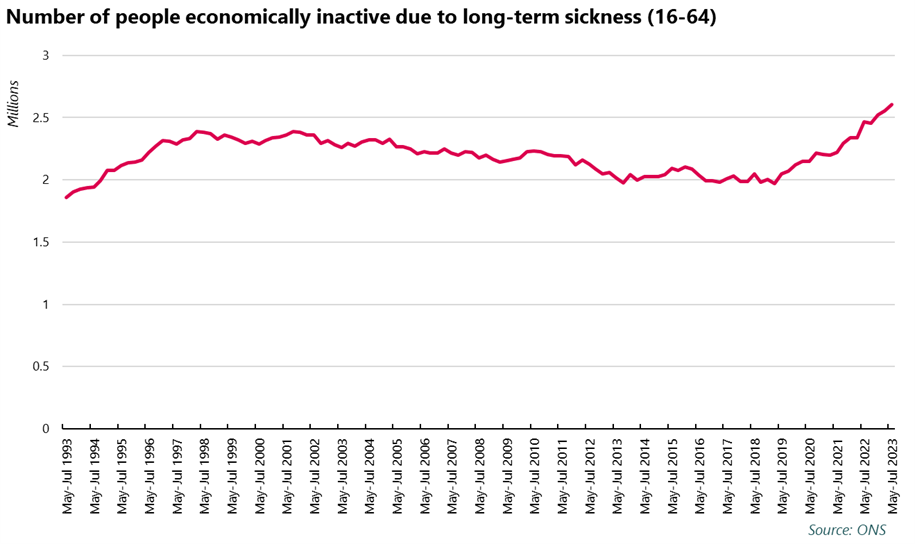
Alarms should also be ringing about long-term sickness. The number of people who are "economically inactive" (not in work, or looking for work) due to long-term sickness continues to rise, hitting a new record high of 2.6 million. There’s talk of making the already tough benefits system even crueller to get disabled people and those with long-term health conditions back into work, but this is clearly the wrong strategy. It will likely force people who are not well enough to work back into work, and won’t address the issues that have led to the rise in inactivity due to long-term sickness. We need a genuinely supportive benefits system, and the government must address the role of ill health in the increase seen in recent years. This means that investing in the NHS, and in particular tackling waiting lists and the recruitment and retention crisis, is a priority.
There are warning signs elsewhere. Vacancies are down and redundancies are up. And we also know from last month’s data that the number of people on zero-hours contracts has hit a record high of 1.18 million.
Overall, there’s little in this data that should hearten the Chancellor. In the run up to his Autumn Statement in November, the labour market is looking fragile. Rises in unemployment and drops in employment look close to those we’d typically see during a recession, and the reported new era of real pay growth that the Chancellor has celebrated is in its infancy and isn’t a reality for workers in many sectors.
Stay Updated
Want to hear about our latest news and blogs?
Sign up now to get it straight to your inbox