Beyond the North-South Divide: one size won’t fit all
The results of last week’s election have once again put into the spotlight the challenges for working people across the country. But we must remember the picture is more complicated than a simple London vs the rest.
The latest regional data on Gross Value Added (GVA which is a measure used to assess regional economic strength and trends) released by the ONS yesterday, confirms what most of us already knew – London, in many respects, has raced ahead of the rest of the regions and nations of the UK in terms of growth and employment since the 2008 crash and throughout the austerity decade.
Economy and Employment GVA growth over time – regions and nations of UK
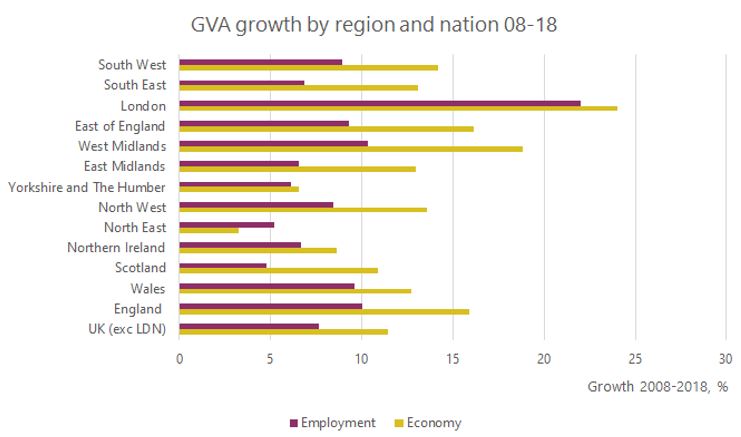
London has seen its economy grow twice as fast as the UK average, growing 24 per cent over the decade, while the average across the rest for the rest of the UK was just over 11 per cent. The disparity is most stark in the North East, where their economy has only grown 3.3 per cent over the same period.
Similarly, on employment, while London saw employment grow nearly 3 times faster by 22 per cent, the rest of the UK lagged at 7.6 per cent.
Some regions are far less behind on economic growth, notably the midlands and southern regions. But looking at combined figures for the North East, North West and Yorkshire and Humber regions, years of rhetoric regarding the Northern powerhouse are yet to materialise.
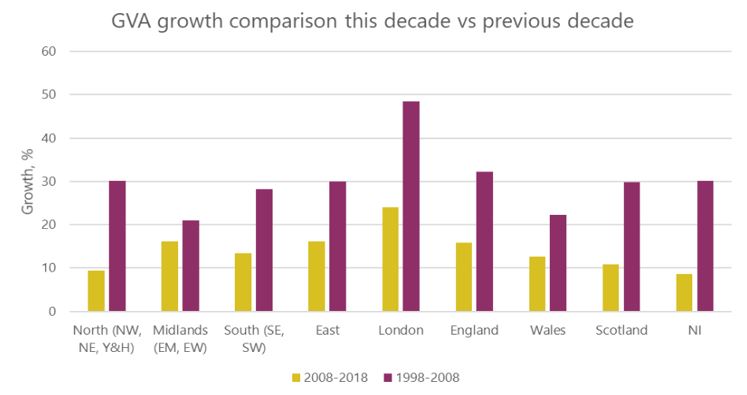
London’s economic growth between 2008 and 2018 has been 2.5 times faster than the northern regions combined and 1.5 times faster than the midlands, and while the trend for London to outpace the rest was apparent in the previous decade – growth in other part of the UK was also much stronger pre-2008.
GVA growth comparison 1998-2008 and 2008-2018, regions and nations of the UK
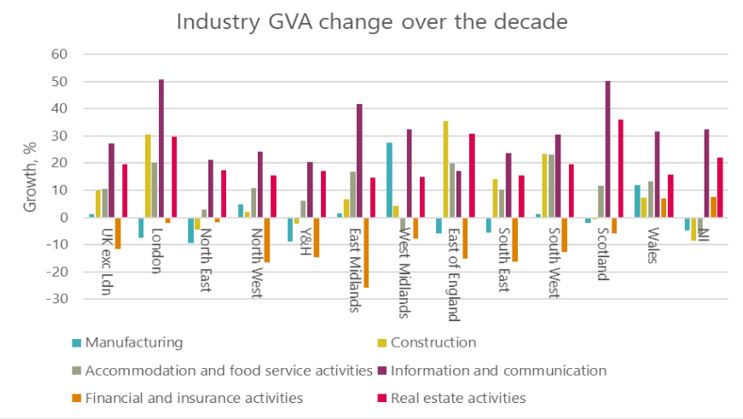
Looking at industry trends, though financial and insurance activities has taken a hit across most of the UK since 2008, London has remained relatively insulated from it, seeing GVA fall only 2.2 per cent in comparison to a UK average drop of 11.4 per cent
Similarly, London has consistently outpaced other regions across the UK in terms of the growth in other industries.
Industry GVA growth 2008-2018
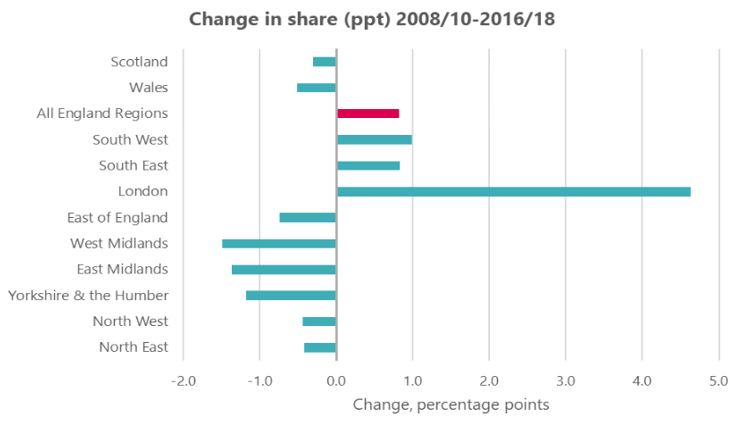
The recent ONS Wealth and Assets Survey also highlighted the disparity between London and the South, and the rest of the regions and nations of the UK. All have seen their share of wealth decline since 2008/10, apart from the south, and clearly London has raced ahead.
Change in share of wealth over time
So, on the surface the North/ South, London versus the rest divide may seem as entrenched as ever - clearly there is much work to be done across the UK and a one size fits all approach will not work. But we must remember working people in London, just like in the North East, or the Midlands are struggling to make ends meet too.
TUC analysis of this years ASHE (Annual Survey of Hours and Earnings) released in October, showed that while London has seen employment levels and its economy and share of wealth grow – this is not necessarily translating into higher pay for workers.
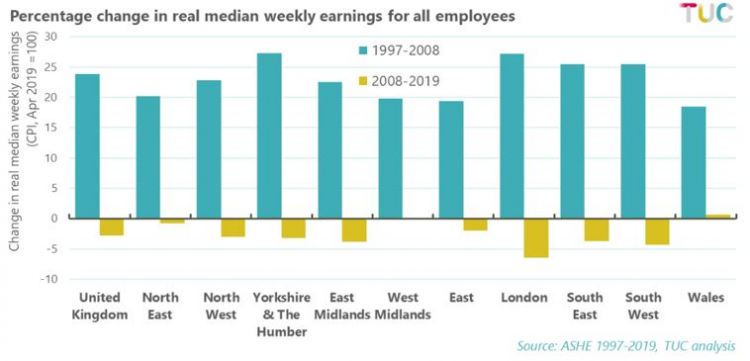
In fact, since 2008, London has seen its wages fall more steeply than the rest of the UK. Pre-2008 every region of the UK was experiencing wage growth.
The wage gap between London and everywhere else may be narrowing, but any narrowing is levelling down and working families across the country are losing out.
Change in real median weekly earnings by region
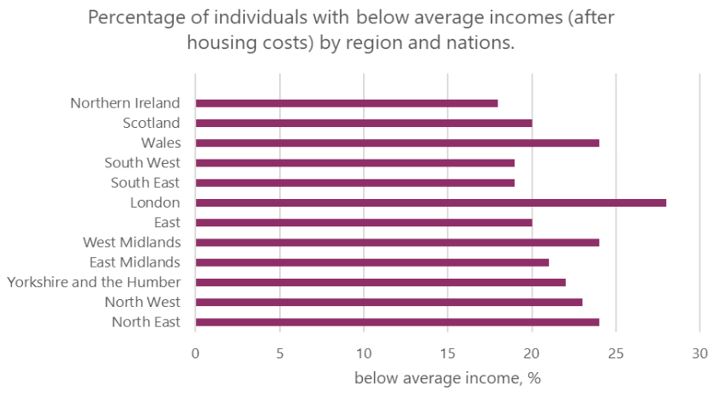
We know poverty persists, with 14 million people living in poverty in the UK. After housing costs, across the UK many regions and nations are experiencing persistent poverty levels of above 20 per cent. For all of the economic and employment growth, London has some of the highest incidences of poverty at 28 per cent – or 2.4 million people living in relative poverty (incomes less than 60% of the median household income) in the capital city.
Individuals with below average incomes by region (%)
There may be differences in the regions and nations of the UK, and conversations about how we give power back to people and their communities are fundamental to moving forward. What is clear though is that for working people, wherever they are in the UK, they are not getting their fair share.
We need a new approach with a genuine end to austerity. No more excuses - the new government must boost living standards for working families, rebuild our public services and invest in communities.
Stay Updated
Want to hear about our latest news and blogs?
Sign up now to get it straight to your inbox