Record wealth inequality shows why our economy is rigged against working people
Every two years the Office for National Statistics (ONS) publishes a ‘Wealth and Assets Survey’ of UK households.
The latest version of the survey, published yesterday, proves that the richest people in the country didn’t pay any price from the last decade of austerity.
According to the figures, the wealthiest households (those who make up the top 10 per cent) own five times more than the bottom 50 per cent.
Viewed another way, those at the top now own 45 per cent of the total wealth of the country, while the bottom 50 per cent of households own just 9 per cent.
Working families have struggled to make ends meet since the 2008/10 survey due to the longest pay squeeze in two centuries and the impact of austerity on their earnings.
But those at the top haven’t had to worry. Their wealth has grown by a whopping £2.6 trillion over the same period – three times as fast as those in the bottom 10 per cent.
Despite all the pain of the last decade, the richest have continued to increase their wealth.
What clearer evidence that the economy is rigged against working people?
At this election, we need a government that will put working families first. That means tackling this inequality and making the country a fairer place for everyone.
What is the Wealth and Assets Survey?
It’s important to understand how unequal our society is if we’re to try and make it fairer.
The Wealth and Assets Survey (WAS), which started in 2006, is a good place to start.
It assesses total private household wealth, including property, private pensions, financial wealth and physical wealth.
You can find out you can find out more about the components of wealth and assets here.
What’s in this year’s survey?
The new WAS shows why the economy just isn’t working for working people.
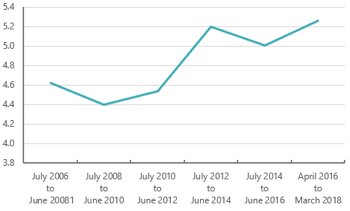
The chart below shows why.
When the 2008/10 survey was published, the top 10 per cent of households owned 4.4 times as much as the bottom 50.
Today they own over five times (5.3) as much, despite the 2008 global financial crisis and the decade of austerity that followed it.
As the chart shows, this is the highest wealth inequality on record.
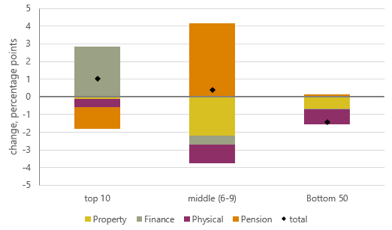
We can delve a little deeper into the factors behind this widening wealth inequality.
The following chart shows that between 2008/10 and 2016/18, the top 10 per cent have seen their share of wealth increasing by one percentage point (to 45 from 44 per cent)
- This has been mainly driven by a massive (£800bn) increase in financial wealth.
The middle 40 per cent have also seen a slight (0.4ppts) gain in their share of total wealth
- This is thanks in large part to a rise in pension wealth.
But all those gains have come at the expense of the bottom 50 per cent of households, whose share of the pie has shrunk by 1.4 ppts over the same period.
And there’s worse news for the bottom 10 per cent, who now only own 0.1 per cent of all wealth in the UK. This means the richest now own 677 times more wealth than those at the very bottom.
The economy is rigged
We blame government policy for the shocking rise in wealth inequality over the last ten years.
Since 2010, successive governments have presided over an economy that favours the rich while making life harder for working families and denying them a fair share of the wealth they create.
To reduce the UK’s shocking wealth gap, we want all political parties standing in the general election to commit to:
- Boosting wages
By raising the minimum wage to £10 immediately and increasing collective bargaining rights. - Improving pension savings
Through the extension of auto-enrolment to all low-paid workers and setting out a pathway to increase minimum contributions. - Electing worker directors onto company boards
Following the norm in most of Europe, where they help ensure a fairer distribution of rewards between workers and shareholders. - Ruling out tax cuts for high earners
Because rebuilding public services is more important and will mean families don’t have to use up their savings to pay privately for services like social care.
Working people have had enough of an economy that is rigged against their interests. At this election, they need change.
That means concrete action to address the growing wealth inequality in our society.
Stay Updated
Want to hear about our latest news and blogs?
Sign up now to get it straight to your inbox