Trades union health and safety reps survey report
This is the 14th TUC survey of health and safety representatives, which we carry out every two years. We use this report to understand the changing experience of safety representatives at work and to help provide more support. We also use the survey to inform our campaigning priorities. We hope that unions and reps can use the report to help with their ongoing work.
The responses provide much a lot of information and background on the profile of safety representatives, the work they do to improve safety and the help they get from employers and enforcement agencies. The survey once again presents an urgent challenge to the trade union movement in how we address the aging profile of our safety reps, as within the next ten years we risk losing a large proportion from the workforce, with younger reps recruited at a much slower pace.
There is some change in this year’s survey compared with the last one. The 2020/21 survey was conducted during the height of the Covid-19 crisis, and several sections of that one dealt specifically with the pandemic. This year’s survey questionnaire made a partial return to the pre-pandemic set of questions. However, since the effects of the virus have not gone away, we still asked safety representatives about how it was being managed in their workplace.
This report is based on an open online survey that was distributed widely and was analysed by the Labour Research Department on behalf of the TUC. The survey ran from 6 December 2022 to 14 February 2023 and attracted a record 3,046 respondents. This is almost a third higher than the number who participated in the 2020/21 survey (2,138), and three times the number responding in 2018 (1,073). Thank you to all those unions who promoted the survey and encouraged responses – and to all who took part in completing it! This ever-increasing number of participants in these surveys indicates that there is no diminution in the commitment of thousands of union reps around the country to protect and improve the health and safety at work of their members and share their experiences.
If you’re a safety rep, make sure to keep in touch and up to date with what we’re offering at TUC Education, from classroom courses to online training https://www.tuc.org.uk/training
Profile of safety representatives and their workplaces
Despite the increase in numbers compared with the 2020/21 survey, there are only slight changes in the profile of safety representatives in terms of their personal characteristics. There is slightly more diversity in terms of ethnic heritage and another shift of the age profile towards the 60+ age bracket.
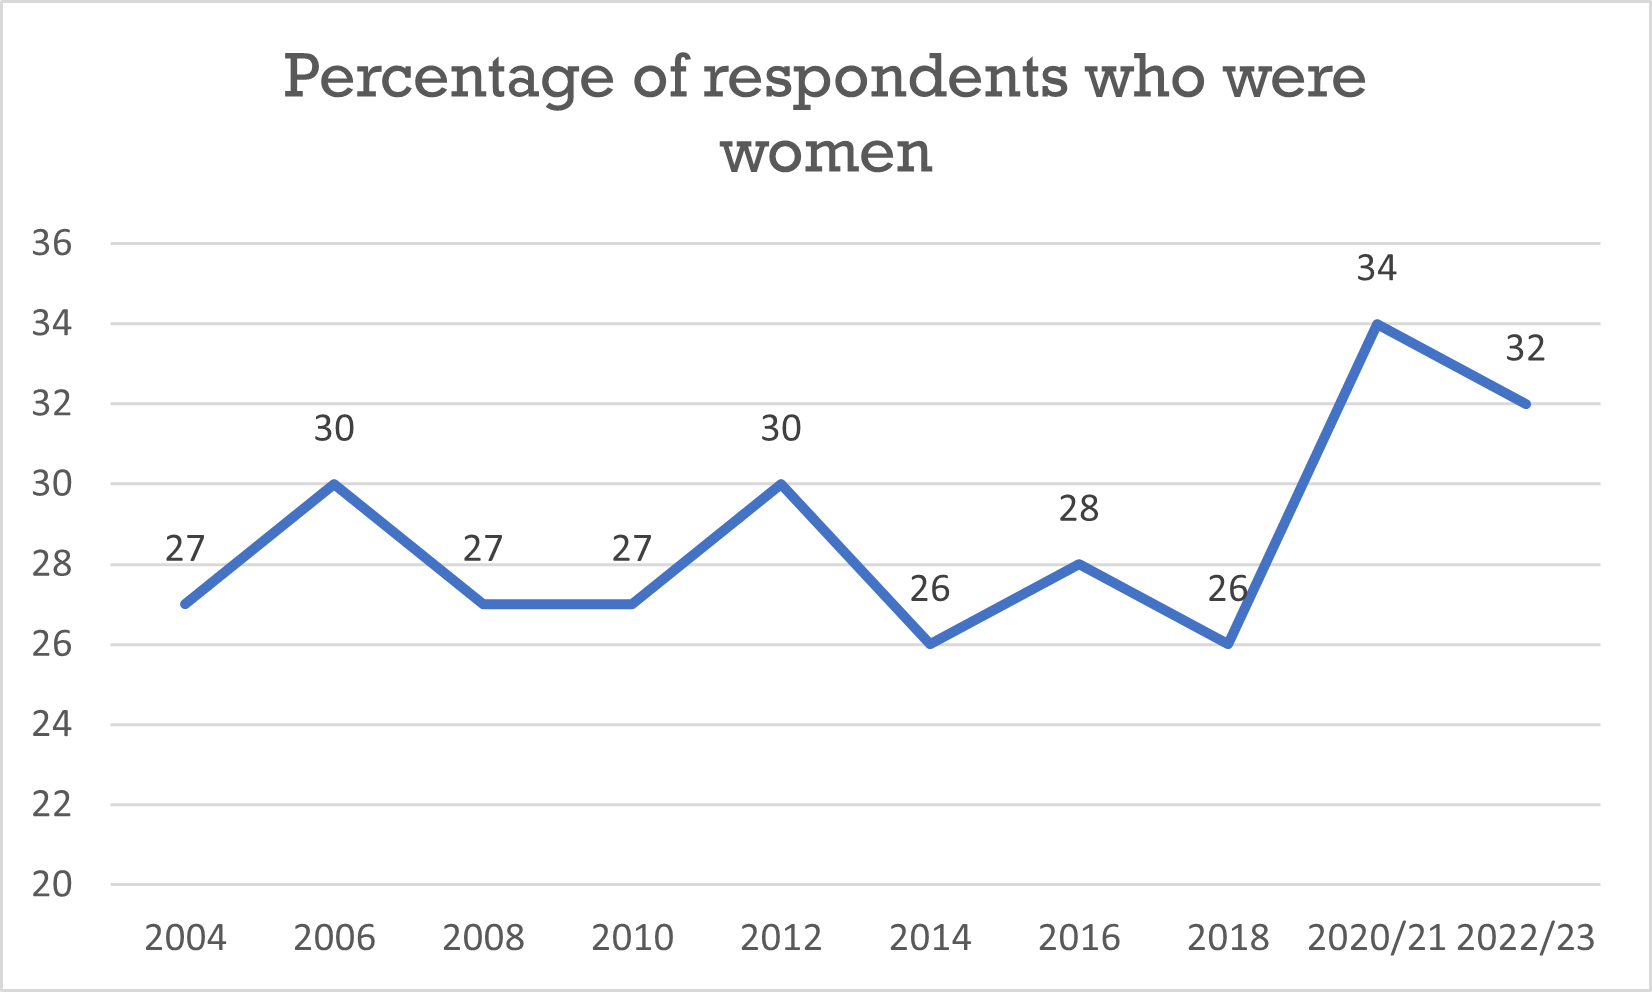
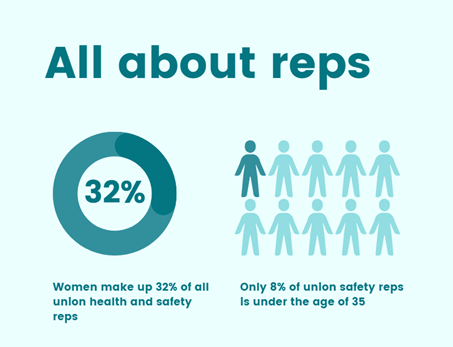
Just under a third (32 per cent) of the safety representatives responding are women – a slightly lower proportion than in 2020/21 but still higher than in previous safety rep surveys (see chart)
One in five (20 per cent) consider themselves to be disabled compared with 19 per cent two years ago.
There has been a small shift in the ethnic profile of respondents. The proportion describing themselves as White (“White British”, White European” or “Other white background”) has fallen slightly to 89 per cent compared with 91 per cent in 2020/21. That figure had already fallen from the range of 93-95 per cent that has been found since 2010. (Before 2010 the categories were substantially changed so the data is not comparable.)
The shift in the last two years has been towards the broad grouping of those with some Asian heritage. A total of 3.6 per cent describe themselves as one of the following: “Asian British”, “Indian”, “Pakistani”, “Bangladeshi”, “Chinese” or “Other Asian background”. This is a rise from 2.8 per cent in the 2020/21 survey.
However, the proportion saying they are either “Black British”, “Black African”, “African Caribbean” or of “other Black background” remained static at 2.6 per cent.
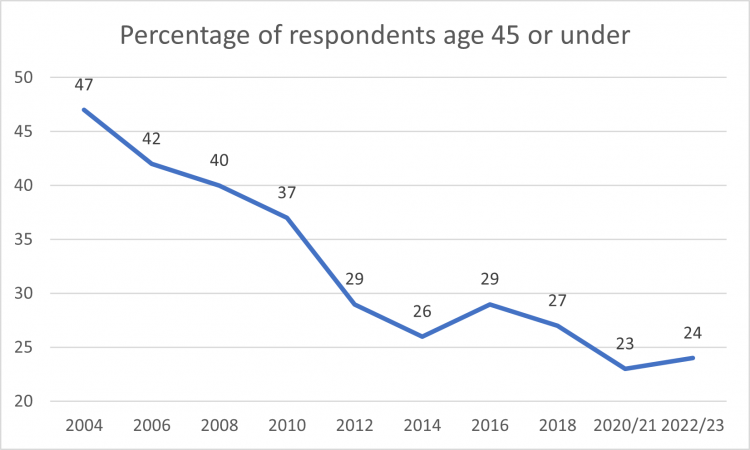
The aging profile of Britain’s safety reps continued over the past two years, with one in five (20 per cent) now aged 60 or over, compared with 16% two years ago. However, the proportion who are aged 45 or under has very slightly increased, from 23 per cent to 24 per cent (see chart).
Table A: Age profile of respondents
|
Age group |
2022/23 |
2020/21 |
|
16–35 |
8% |
8% |
|
36–45 |
16% |
15% |
|
46–60 |
56% |
61% |
|
60+ |
20% |
16% |
Although the personal characteristics of survey respondents have changed only slightly compared with two years ago, there is more substantial change in terms of the workplaces they hail from.
There was a marked difference in spread of respondents in terms of the economic sector they are employed in. The sectoral pattern of participants responding to the 2020/21 survey, which was conducted during the Covid-19 pandemic, was likely to have been affected by the way in which workplaces were operating (or not operating) in that unusual period. The profile revealed this time is closer to that found in the 2018 survey.
So, in the latest survey, just 56 per cent work in the public sector, compared with 67 per cent in the pandemic survey, the figure having returned closer to the 53 per cent found in 2018. Meanwhile, 38 per cent work in the private sector, compared with 29 per cent in 2020/21 and 45 per cent in 2018.
Table B: Sectoral profile of respondents
|
|
2022/23 |
2020/21 |
2018 |
|
Public sector |
56% |
67% |
53% |
|
Private sector |
38% |
29% |
45% |
|
Not for profit/voluntary |
3% |
2% |
3% |
In terms of the industrial spread, the largest group of respondents (19 per cent) work in ”other services”, followed far behind by those in transport and communications (13 per cent), education (12%) and health services (12%).
Again there is a notable difference between this and the pandemic survey, when safety reps in education (along with those in “other services”) formed the biggest group, accounting for 17 per cent of respondents. Other industries seeing a smaller share of representation in the current survey are transport and communications and local government, while there is a slightly higher proportion this time around from manufacturing and from distribution.
Table C: Industry profile of respondents
|
2022/23 |
2020/21 |
2018 |
|
|
Other services (588) |
19% |
17% |
17% |
|
Transport and communications (384) |
13% |
16% |
38% |
|
Education (353) |
12% |
17% |
7% |
|
Health services (377) |
12% |
11% |
13% |
|
Manufacturing (294) |
10% |
7% |
6% |
|
Distribution (271) |
9% |
6% |
na* |
|
Local government (267) |
9% |
12% |
6% |
|
Central government (181) |
6% |
8% |
4% |
|
Energy and water (100) |
3% |
2% |
4% |
|
Banking, insurance and finance (67) |
2% |
2% |
0% |
|
Construction (38) |
1% |
1% |
1% |
|
Entertainment (28) |
1% |
na |
na |
|
Hospitality (20) |
1% |
0%** |
na* |
|
Voluntary/not-for profit sector (34) |
1% |
0% |
0% |
|
Agriculture and fishing (8) |
0% |
0% |
0% |
|
Leisure services (12) |
0% |
1% |
1% |
*Distribution, hotels and restaurants were one category in 2018 and accounted for 3 per cent of respondents. **This category was defined as hotels and restaurants in 2020/21.
There has also been a change in the size of workplaces represented in the survey, with a higher proportion of respondents coming from larger workplaces. One in three respondents (33 per cent) work in workplaces with over a thousand staff compared with 28 per cent in 2020/21. And just 21 per cent come from the smallest workplaces – those with fewer than 100 workers – compared with 28 per cent two years ago.
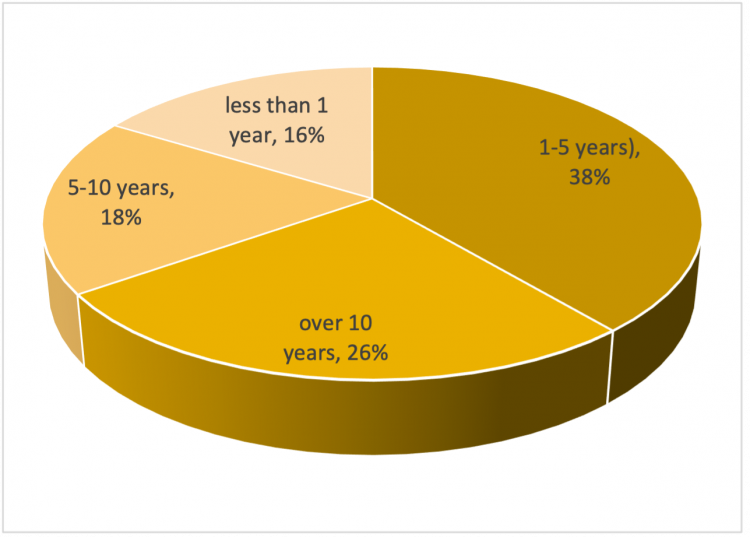
Forty-four per cent of safety reps have been in the role for more than five years – pretty much the same as in 2020/21 (45 per cent). Sixteen per cent have been a safety rep for less than a year (compared with 18 per cent in 2020/21), while 38 per cent have been in the role for one to five years (compared with 35 per cent).
Time respondent has been a safety rep:
Seventy per cent of respondents are also union reps or stewards, maintaining the level in the 2020/21 pandemic survey (69 per cent) which had shown a substantial increase on the 2018 figure of 42 per cent.
The majority of respondents (68 per cent) said there are other safety reps in their workplace as well as themselves.
Safety representatives responded to the survey from all regions/countries of the UK. The largest groups came from North West England (13 per cent), Scotland (12 per cent) and South East England (11 per cent).
Ninety-six per cent have access to the internet at home (98 per cent in 2020/21) and 85 per cent do so at work, as in 2020/21.
Section 2: Hazards at work
Main hazards
Safety representatives were asked to identify the main hazards of concern to workers at their workplace and to identify the top five of their concerns in order of importance. All those mentioned as being in respondents’ top five were aggregated to provide a table of “top-five concerns” across all survey respondents (see chart).
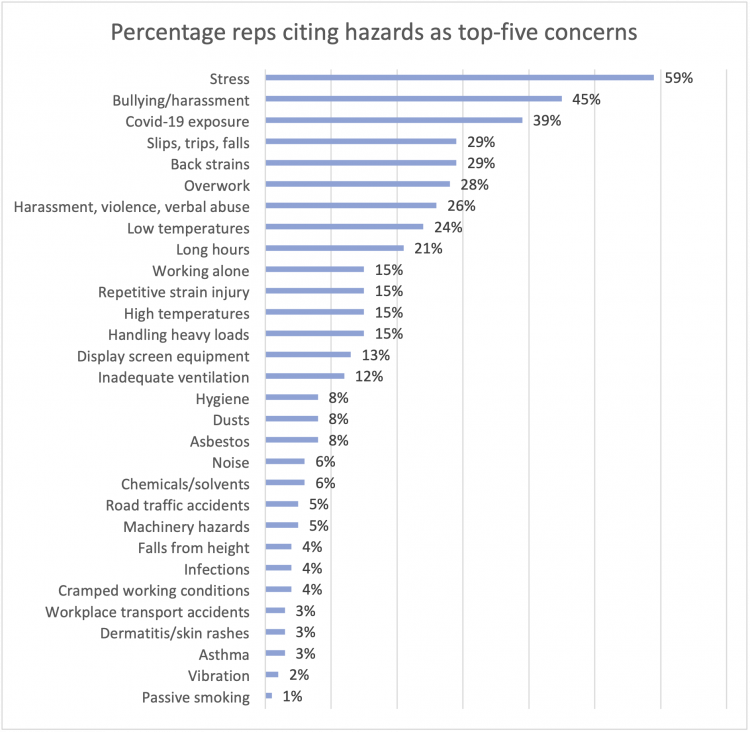
This shows that, of all the hazards listed, stress is the most widespread top-five concern, cited by 59 per cent of safety reps. The other most frequently cited main hazards of concern were “bullying/harassment”, “Covid-19 exposure” (newly added to this list this year), “slips, trips, falls”, “back strains” and “overwork”. “Harassment, violence and verbal abuse” was in seventh place, cited by over one in four safety reps, with almost as many saying there are serious concerns about low temperatures.
Two further categories newly introduced this year – “inadequate ventilation” and “hygiene” – were cited as a top-five concern by 12 per cent and eight per cent of reps respectively.
Table 1 compares the proportion of respondents citing each hazard as a top-five concern over the last few years.
However, it should be noted that the proportions in some cases are not directly comparable with previous years – particularly because of the inclusion for the first time of the hazards “Covid-19 exposure”, “inadequate ventilation” and “hygiene”. (If respondents have selected any of these in their top five list of concerns, certain other hazards which were previously selected will drop out of their list.)
So, while stress is still the most commonly cited top-five concern – as it has been in every survey since the category was defined as such in 2010 – it would appear to be less commonly selected this time around. This is very likely to be because of the addition of the new categories of hazard to the list, which for some workplaces may be even more concerning than stress.
It is evident from another statistic that stress is still the most widespread hazard concerning reps, if not necessarily picked out as one of their worst five: when they were asked to select all hazards that had been of concern at their workplace, 73 per cent checked stress, very similar to the 76 per cent citing it in 2020/21.
Overwork and long hours are still commonly cited hazards but appear to be on a slightly declining trend in terms of the proportion of reps that view them as a top-five concern. The same goes for repetitive strain injury and display screen equipment. Concern over low temperatures, on the other hand, has gone very clearly in the opposite direction ever since 2016, when just 12 per cent of reps picked it out it as a top-five concern.
Again, the note of caution in all these trends is that the inclusion of Covid-19 exposure may have knocked other hazards out of some reps’ top-five list.
Table 1:  Proportion of safety reps citing hazard in their top five concerns
|
2022/23 |
2020/21 |
2018 |
2016 |
|
|
Stress |
59% |
70% |
69% |
70% |
|
Bullying/harassment |
45% |
48% |
45% |
48% |
|
Covid-19 exposure* |
39% |
na |
na |
na |
|
Back strains |
29% |
29% |
32% |
32% |
|
Slips, trips, falls |
29% |
30% |
31% |
28% |
|
Overwork |
28% |
35% |
36% |
40% |
|
Harassment, violence, verbal abuse** |
26% |
31% |
23% |
24% |
|
Low temperatures |
24% |
20% |
14% |
12% |
|
Long hours |
21% |
29% |
29% |
30% |
|
Handling heavy loads |
15% |
14% |
14% |
13% |
|
High temperatures |
15% |
18% |
14% |
16% |
|
Repetitive strain injury |
15% |
18% |
23% |
26% |
|
Working alone |
15% |
19% |
25% |
18% |
|
Display screen equipment |
13% |
21% |
18% |
21% |
|
Inadequate ventilation |
12% |
na |
na |
na |
|
Asbestos |
8% |
10% |
9% |
10% |
|
Dusts |
8% |
10% |
10% |
9% |
|
Hygiene |
8% |
na |
na |
na |
|
Chemicals/solvents |
6% |
5% |
5% |
6% |
|
Noise |
6% |
9% |
11% |
11% |
|
Machinery hazards |
5% |
4% |
5% |
5% |
|
Road traffic accidents |
5% |
4% |
10% |
7% |
|
Cramped working conditions |
4% |
6% |
7% |
6% |
|
Falls from height*** |
4% |
4% |
7% |
6% |
|
Infections |
4% |
10% |
5% |
5% |
|
Asthma |
3% |
4% |
2% |
1% |
|
Dermatitis/skin rashes |
3% |
4% |
4% |
3% |
|
Workplace transport accidents |
3% |
5% |
8% |
5% |
|
Vibration |
2% |
2% |
3% |
4% |
|
Passive smoking |
1% |
2% |
3% |
2% |
* In 2020/21 Covid-19 was dealt with separately from other workplace hazards.
**This category has been redefined. In 2020/21 it was “harassment, violence and verbal threats” and prior to that it was “violence and threats”.
*** In 2020/21 this category was redefined. Was previously “slips, trips, falls from height”.
Hazards by sector
Certain hazards are much more prevalent in the public sector and others in the private sector. While this is not surprising in some cases, for example in relation to certain physical hazards found predominantly in private sector industries, it is less obvious for others.
Table 2 separates the results into public and private sectors, still concentrating on safety representatives’ top-five concerns.
Table 2: Hazards by public/private sectors
|
Public |
Private |
|
|
Stress |
64% |
52% |
|
Bullying/harassment |
49% |
39% |
|
Covid-19 exposure |
45% |
31% |
|
Overwork |
33% |
21% |
|
Harassment, violence, verbal abuse |
30% |
21% |
|
Back strains |
26% |
35% |
|
Low temperatures |
23% |
25% |
|
Long hours |
22% |
20% |
|
Slips, trips, falls |
20% |
41% |
|
Working alone |
18% |
12% |
|
Display screen equipment |
16% |
9% |
|
Inadequate ventilation |
15% |
8% |
|
High temperatures |
14% |
16% |
|
Repetitive strain injury |
12% |
19% |
|
Handling heavy loads |
11% |
20% |
|
Asbestos |
9% |
8% |
|
Hygiene |
7% |
9% |
|
Dusts |
5% |
12% |
|
Noise |
5% |
8% |
|
Infections |
5% |
1% |
|
Chemicals/solvents |
4% |
8% |
|
Cramped working conditions |
4% |
4% |
|
Road traffic accidents |
3% |
9% |
|
Machinery hazards |
3% |
7% |
|
Dermatitis/skin rashes |
3% |
3% |
|
Asthma |
3% |
2% |
|
Falls from height |
2% |
7% |
|
Workplace transport accidents |
2% |
5% |
|
Vibration |
2% |
2% |
|
Passive smoking |
1% |
1% |
Stress is the most common top-five concern in both sectors, but it is a more likely to be a top-five concern in the public sector than the private sector (64 per cent citing it compared with 52 per cent).
Bullying/harassment is also of widespread concern in both sectors but more so in the public sector (49 per cent compared with 39 per cent in the private sector). It is the second most common top-five concern in the public sector, whereas in the private sector it is (just) topped by slips, trips, falls. This hazard was picked as a top-five concern by twice as many reps in the private sector (41 per cent) as in the public sector (20 per cent).
Interestingly, Covid-19 exposure is substantially more likely to be a top-five concern in the public sector (45 per cent) than in the private sector (31 per cent), where back strains is a more common top-five concern (35 per cent) than Covid-19.
Overwork and harassment/violence/verbal abuse are both more likely to be picked as top-five concerns in the public sector than the private sector. On the other hand, handling heavy loads is a much more common serious concern in the private sector than the public sector.
A perhaps surprising finding comes in the increased concern over low temperatures, particularly in the public sector. While the proportion of reps citing low temperatures as a top-five concern has increased in both sectors since the 2020/21 survey, in the public sector it has jumped from tenth most widespread concern to seventh. In that sector it has overtaken long hours, slips/trips/falls, display screen equipment and working alone (and would have been in sixth place without the addition of Covid-19).
Hazards by gender and age
Given our understanding of how certain demographics are under-represented among the safety rep population, we felt it may be a useful exercise to see if there was any difference in the hazards identified based on gender and age, based on the size of the data set for these two sub-groups.
In addition to there being a differentiation by industrial sector, we found that reps were also likely to report a difference in top hazards depending on their gender and/or age. For example, women were 10% more likely to report over work and stress, whereas men were more than twice as likely to report asbestos, dust, or road traffic accidents as an occupational health risk in their workplaces. This reflects the fact that some sectors are still men-dominated in their employment, but it also points to OSH trends whereby the health and safety issues women face can be disproportionate or different entirely based on gendered job roles or physiology.
Note: any hazard where there was no difference in percentage reporting has been removed.
Top hazards by gender
|
Men |
Women |
|
|
Stress |
56% |
65% |
|
Bullying/harassment |
44% |
46% |
|
Covid-19 exposure |
38% |
41% |
|
Overwork |
25% |
35% |
|
Harassment, violence, verbal abuse |
24% |
30% |
|
Back strains |
30% |
29% |
|
Low temperatures |
22% |
27% |
|
Long hours |
21% |
21% |
|
Slips, trips, falls |
32% |
21% |
|
Working alone |
14% |
18% |
|
Display screen equipment |
12% |
16% |
|
High temperatures |
15% |
16% |
|
Inadequate ventilation |
11% |
15% |
|
Handling heavy loads |
16% |
12% |
|
Infections |
3% |
5% |
|
Asbestos |
10% |
4% |
|
Asthma |
2% |
4% |
|
Dusts |
10% |
4% |
|
Noise |
7% |
4% |
|
Chemicals/solvents |
8% |
3% |
|
Dermatitis/skin rashes |
2% |
3% |
|
Machinery hazards |
6% |
1% |
|
Road traffic accidents |
8% |
1% |
|
Falls from height |
6% |
1% |
|
Workplace transport accidents |
4% |
1% |
|
Vibration |
3% |
0% |
Across most hazards, there was little variation between younger and older reps. However, there were some notable differences.
While stress was the most commonly reported workplace hazard across every other age group, 16 – 25 year olds were more likely to select Covid-19 than stress (50% selected Covid-19; 38% selected stress). This is true, too, of the related hazard ‘infections’, which reps in the youngest age group were seven times more likely to report (21%) than in the oldest age group (3%).
Younger reps were also less likely to report bullying and harassment as a common concern, with 25 – 32% in the 16 – 35 age group selecting it as a top 5 hazard, compared with 45 – 48% in the 46 – 60-year age groups.
Top hazards by age
|
Bullying/harassment |
Age |
||||
|
16-25 |
26-35 |
36-45 |
46-60 |
Over 60 |
|
|
25% |
32% |
45% |
45% |
48% |
|
|
Covid-19 exposure |
Age |
||||
|
16-25 |
26-35 |
36-45 |
46-60 |
Over 60 |
|
|
50% |
34% |
38% |
40% |
38% |
|
|
Infections |
Age |
||||
|
16-25 |
26-35 |
36-45 |
46-60 |
Over 60 |
|
|
21% |
5% |
3% |
4% |
3% |
|
|
Stress |
Age |
||||
|
16-25 |
26-35 |
36-45 |
46-60 |
Over 60 |
|
|
38% |
57% |
60% |
59% |
58% |
|
Hazards by industrial sector
Table 0 sets out the most widely cited top-five hazards of concern in each industry.
Stress is the most widespread top-five concern in 11 of the 16 industrial sectors. Bullying and harassment is at least the second most widespread concern in eight of the sectors.
Table 0: The five main hazards of concern by industry
|
Sector |
1st concern |
2nd concern |
3rd concern |
4th concern |
5th concern |
|
Agriculture & fishing |
Chemicals /solvents, machinery hazards, both 38% |
Back strains, cramped conditions, handling heavy loads, hygiene, inadequate ventilation, low temperatures, noise, passive smoking, all 25% |
|||
|
Banking, insurance & finance |
Stress 67% |
Covid-19 exposure 49% |
Display screen equipment 42% |
Low temperatures 36% |
Bullying/harassment 34% |
|
Central government |
Stress 73% |
Bullying/ harassment 67% |
Covid-19 exposure 56% |
Display screen equipment 37% |
Overwork 35% |
|
Construction |
Stress 47% |
Slips/ trips/ falls 32% |
Bullying/ harassment 39% |
Back strains, harassment/ violence/ verbal abuse, both 29% |
|
|
Distribution |
Back strains 54% |
Stress 49% |
Slips/ trips/ falls 47% |
Heavy loads 40% |
Bullying/ harassment 39% |
|
Education |
Stress 68% |
Covid-19 exposure 49% |
Bullying/ harassment, overwork, both 48% |
Long hours 29% |
|
|
Energy & water |
Stress 66% |
Covid-19 exposure 41% |
Slips/ trips/ falls 35% |
Bullying/ harassment 32% |
Long hours 24% |
|
Entertainment |
Bullying/ harassment, long hours, both 43% |
Back strains, noise, repetitive strain injury, stress, all 29% |
|||
|
Health services |
Stress 69% |
Bullying/ harassment 50% |
Covid-19 exposure 46% |
Overwork 41% |
Back strains 36% |
|
Hospitality |
Low temperatures 55% |
Harassment/ violence/verbal abuse 45% |
Slips/ trips/ falls 40% |
Stress 35% |
Bullying/ harassment 30% |
|
Leisure services |
Low temperatures 67% |
Bullying/ harassment, Covid-19 exposure, stress, all 50% |
High temperatures, slips/ trips/ falls, harassment/ violence/ verbal abuse, all 33% |
||
|
Local government |
Stress 67% |
Bullying/ harassment 52% |
Covid-19 exposure 44% |
Harassment/ violence/ verbal abuse 39% |
Overwork 30% |
|
Manufacturing |
Stress 45% |
Slips/ trips/ falls 44% |
Back strains 39% |
Bullying/ harassment 33% |
Dusts 26% |
|
Other services |
Stress 58% |
Bullying/ harassment 46% |
Slips/ trips/ falls 41% |
Covid-19 exposure 40% |
Harassment/ violence/ verbal abuse 37% |
|
Transport & communications |
Stress 73% |
Bullying/ harassment 67% |
Covid-19 exposure 56% |
Display screen equipment 37% |
Overwork 35% |
|
Voluntary/not for profit |
Stress 56% |
Bullying/ harassment, Covid-19 exposure, display screen equipment, all 38% |
Harassment/ violence/ verbal abuse 35% |
||
There are some notable differences in some industries compared with the 2020/21 safety reps survey:
Agriculture and fishing - because of the small number of respondents from this sector, it is hard to draw comparisons with previous years. However, it is interesting to note that, this time around, the top concerns were all “physical” hazards, whereas in 2020/21, they were psychosocial (bullying and harassment, long hours, overwork and stress).
Banking insurance and finance – this sector attracted double the number of respondents compared with 2020/21, but the top concern – stress - remained the same. Covid-19 exposure entered the list at third place, but perhaps more notable is that bullying and harassment came in the top five, which it did not in the last survey. Knocked out of the previous list were high temperatures and back strains.
Central government – the only substantial change here is that Covid-19 exposure entered the top five concerns, just knocking out harassment/violence/verbal abuse.
Construction – the numbers responding from this sector doubled compared with 2020/21, and the most widespread concern changed from slips, trips and falls to stress. Bullying/harassment has become a slightly more widespread concern, and harassment/violence/verbal abuse has newly entered the top five.
Distribution – the number of reps responding from this industry has soared – from 109 in 2020/21 to 271 this time around. And the number one concern has shifted along with that change. Whereas last time it was stress, it is now back strains, which was named as a top five concern by more than half of reps.
Education – while stress remains the number one hazard, concern over Covid-19 exposure has jumped to become the second most widespread hazard of concern, jumping ahead of overwork. And long hours - previously at number three in the list – has been pushed into fifth place, with bullying/harassment of even more widespread concern.
Energy and water – the number of safety reps responding from this sector is more than three times as high as in 2020/21. Covid-19 exposure and long hours have newly entered their top five concerns, knocking out back strains and display screen equipment.
Entertainment – this was a newly defined industrial category in this year’s survey, whose most widespread concerns are bullying/harassment and long hours.
Health services – this is the largest group by industry taking part in the survey this year – and the number responding has doubled compared with two years ago. The top five hazards are very similar to those identified in 2020/21, except that the inclusion of Covid-19 exposure has knocked harassment/violence/verbal abuse out of the list.
Hospitality – this industrial category is slightly different from the “hotels and restaurants” category used in the 2020/21 survey. It attracted 20 respondents, compared with just 1 two years ago, and they put low temperatures at the top of the list of concerns.
Leisure services – this was one of the few sectors which returned a lower number of responses than in 2020/21. Two thirds of those who did participate said low temperatures were in their top five concerns.
Local government – the top five concerns in this sector were the same as in 2021-22, except for Covid-19 exposure jumping into third place, knocking working alone into sixth place.
Manufacturing – this sector returned many more reps than in the last survey. Nevertheless the main concerns were pretty much as they were two years ago, except that concern over dust just replaced repetitive strain injury in the top five.
Other services – almost twice as many reps responded from this sector than did two years ago. The top-five list remained similar, though the inclusion of Covid-19 exposure knocked the previous fifth-place back strains out of the list. In fact, low temperatures (in sixth place) was an even more widespread concern than back strains this time around.
Transport and communications – fewer reps responded from transport and communications than did two years ago, and the top five concerns also changed somewhat. Stress and bullying/harassment are still the two most common, and are even more dominant in the list than last time, but thereafter the concerns change. As well as the addition of Covid-19 exposure, display screen equipment and overwork are in the list, which they were not in 2020/21, when the remaining most widespread concerns were slips/trips/falls, long hours and harassment/violence/verbal threats.
Voluntary/not-for-profit – this sector was slightly redefined from the previous “voluntary sector” category, from which only eight reps sector responded in 2020/21. New to the top five concerns this time are Covid-19 exposure and display screen equipment.
Hazards by workplace size
Table 3 shows that stress is, as in previous surveys, the most widespread top-five concern in all sizes of workplace, and it seems to take more prominence the larger the workplace. Again, in all sizes of workplace the second spot is taken by either bullying/harassment or Covid-19 exposure, with the other one of those two hazards taking the next place.
Long hours are among the most common top-five concerns in the very smallest and largest workplaces.
Table 3: Most common top-five concerns in workplaces of different sizes
|
Number of workers (number of responses in group |
1st concern |
2nd concern |
3rd concern |
4th concern |
5th concern |
|
Under 5 (24) |
Stress 46% |
Bullying/ harassment 38% |
Covid-19 exposure, long hours, slips/ trips/ falls, all 25% |
||
|
6-50 (358) |
Stress 51% |
Covid-19 exposure 41% |
Bullying/harassment 33% |
Back strains, harassment/ violence/ verbal abuse, both 29% |
|
|
51-100 (285) |
Stress 55% |
Covid-19 exposure 43% |
Bullying/harassment 39% |
Back strains 30% |
Overwork 28% |
|
101-200 (448) |
Stress 54% |
Bullying/harassment 40% |
Covid-19 exposure 38% |
Low temperatures, slips/ trips/ falls, harassment/ violence/ verbal abuse, all 29% |
|
|
201-1,000 (915) |
Stress 57% |
Bullying/harassment 45% |
Covid-19 exposure 35% |
Slips/ trips/ falls 35% |
Back strains 33% |
|
Over 1,000 (1,006) |
Stress 67% |
Bullying/harassment 53% |
Covid-19 exposure 41% |
Overwork 35% |
Back strains, long hours, both 26% |
Table 4 sets out how the most common top-five hazards overall vary by workplace size. It suggests that stress is more widespread as a top concern in the larger workplaces, and less common in the very smallest. Bullying /harassment is also more widespread in the larger workplaces. On the other hand, concern over low temperatures is less widespread in largest workplaces.
Table 4: Most common concerns overall by workplace size
|
|
Under 5 workers |
6-50 workers |
51-100 workers |
101-200 workers |
201-1,000 workers |
Over 1,000 workers |
|
Stress |
46% |
51% |
55% |
54% |
57% |
67% |
|
Bullying/harassment |
38% |
33% |
39% |
40% |
45% |
53% |
|
Covid-19 exposure* |
25% |
41% |
43% |
38% |
35% |
41% |
|
Back strains |
17% |
29% |
30% |
28% |
33% |
26% |
|
Slips, trips, falls |
25% |
23% |
26% |
29% |
35% |
25% |
|
Overwork |
8% |
24% |
28% |
30% |
22% |
35% |
|
Harassment, violence, verbal abuse** |
17% |
29% |
26% |
29% |
22% |
26% |
|
Low temperatures |
21% |
26% |
27% |
29% |
29% |
15% |
|
Long hours |
26% |
16% |
22% |
29% |
18% |
26% |
Hazards by region/country
Table 5 sets out the most common top-five hazards of concern in the various regions and nations of Great Britain. Northern Ireland was not included for analysis in this year’s survey, while a new “region” established for the survey was “Other British Isles”.
Table 5: Main hazards of concern by region/country
|
Region/nation |
1st concern |
2nd concern |
3rd concern |
4th concern |
5th concern |
|
East Midlands |
Stress 54% |
Bullying/ harassment 42% |
Slips/ trips/ falls 36% |
Back strains 35% |
Covid-19 exposure 31% |
|
East of England |
Stress 54% |
Bullying/ harassment 45% |
Covid-19 exposure 42% |
Overwork, slips/ trips/ falls, both 28% |
|
|
London |
Stress 58% |
Bullying/ harassment 49% |
Covid-19 exposure 39% |
Back strains, harassment/ violence/ verbal abuse, both 31% |
|
|
North East England |
Stress 65% |
Covid-19 exposure 42% |
Bullying/ harassment 41% |
Overwork 31% |
Back strains, slips/ trips/ falls, both 29% |
|
North West England |
Stress 63% |
Bullying/ harassment 45% |
Covid-19 exposure 38% |
Back strains 30% |
Slips/ trips/ falls 29% |
|
Scotland |
Stress 61% |
Bullying/ harassment 45% |
Covid-19 exposure 43% |
Overwork 33% |
Slips/ trips/ falls, harassment/ violence/ verbal abuse, both 28% |
|
South East England |
Stress 57% |
Bullying/ harassment 43% |
Covid-19 exposure 42% |
Back strains 32% |
Overwork 29% |
|
South West England |
Stress 57% |
Bullying/ harassment 43% |
Slips/ trips/ falls 38% |
Covid-19 exposure 33% |
Overwork 28% |
|
Wales |
Stress 53% |
Bullying/ harassment 47% |
Covid-19 exposure 34% |
Back strains 30% |
Slips/ trips/ falls 27% |
|
West Midlands |
Stress 62% |
Bullying/ harassment 50% |
Covid-19 exposure 40% |
Overwork 31% |
Back strains 29% |
|
Yorkshire and Humberside |
Stress 63% |
Bullying/ harassment, Covid-19 exposure, both 45% |
Overwork 33% |
Low temperatures, harassment/ violence/ verbal abuse, both 29% |
|
|
Other British Isles |
Stress 53% |
Covid-19 exposure 45% |
Bullying/ harassment 38% |
Harassment/ violence/ verbal abuse 32% |
Back strains 30% |
Stress is the most widespread concern in all regions and nations and bullying/harassment is second or joint top in all except North East England and Other British Isles, where in both cases it comes third after Covid-19 exposure.
As well as the inclusion of Covid-19 exposure, which features in the most widespread top-five concerns in all regions and nations, there are a few minor changes compared with the 2020/21 survey. For example, in the East of England and North East England, overwork has newly entered the most cited top five hazards, while London, North West England, Wales and the West Midlands have seen the inclusion of back strains in their lists.
Slips, trips, falls are a new entry to Scotland’s most common concerns and low temperatures are now in the list in Yorkshire and Humberside.
Section 3: Managing health and safety
Safety representatives were asked about the way health and safety is managed in their workplace. In particular, the TUC asked about health and safety policies, risk assessments, occupational health services and management of Covid-19 at work.
Health and safety policies
Overall, 93 per cent of safety reps said their employer has a written health and safety policy – slightly fewer that in 2020/21 (95 per cent), but the same figure as in 2018. The larger the workplace, the more likely the respondent was to say there is a policy. However, reps from the smaller workplaces were much less likely to know if there is policy (a finding in itself), so it is not a clear picture of their actual prevalence.
Safety reps in the private sector were slightly more likely than those in the public and voluntary/not-for-profit sectors to say their employer has a written health and safety policy but again are more likely to know than those in the other economic sectors.
There is little difference in the prevalence of written polices between industrial sectors, except that only 75 per cent of reps in entertainment said there is one. However, this sector also had a much higher proportion of “don’t knows” on this – at 18 per cent compared with an average of 5 per cent. Reps in banking, insurance and finance and those in other services were also less likely than average to know if there is a policy (10 per cent in both cases).
Formal risk assessments
The proportion of respondents saying their management has done any formal risk assessments in the last two years is on the decline. This time the figure is 71 per cent, compared with 74 per cent in 2020/21, which had already seen a fall from the 80 per cent in 2018. However, almost one in five (18 per cent) did not know whether there had been a risk assessment or not (17 per cent in 2020/21).
Table 6 shows the variation by industry in the prevalence of formal risk assessments conducted in the last two years but also an indication of the degree to which safety representatives are aware of them having been done.
Table 6: Formal risk assessment done by industry
|
Yes |
Don’t know |
|
|
Construction |
87% |
8% |
|
Central government |
87% |
11% |
|
Voluntary/not-for profit sector |
85% |
12% |
|
Manufacturing |
83% |
10% |
|
Education |
80% |
13% |
|
Local government |
79% |
10% |
|
Energy and water |
76% |
17% |
|
Leisure services |
75% |
- |
|
Health services |
72% |
17% |
|
Transport and communications |
72% |
17% |
|
Banking, insurance and finance |
70% |
24% |
|
Entertainment |
64% |
18% |
|
Agriculture and fishing |
63% |
38% |
|
Distribution |
63% |
24% |
|
Hospitality |
55% |
40% |
|
Other services |
51% |
32% |
It appears that they are most likely to have been carried out in construction, central government and voluntary/not-for-profit establishments and least likely to in agriculture and fishing, distribution, hospitality and other services. However, it is also evident that relatively large proportions of respondents in those bottom sectors in the table are less likely to know whether they have.
As in the last survey, 94 per cent of the safety representatives who said risk assessments had been carried out cent said the assessments had been written down.
Seventy per cent said that the risk assessments had covered all roles carried out by agency and self-employed workers as well as those directly employed. That is an improvement on the 60 per cent saying so two years ago. Eighteen per cent said they did not know whether they had (24 per cent in 2020/21).
Two-thirds (67 per cent) of respondents feel their management’s risk assessment was adequate, with 19 per cent disagreeing. However, this indicates a slightly higher level of satisfaction than two years ago, when just 62 per cent felt they were adequate while 23 per cent felt they were inadequate. Satisfaction was higher in the smaller workplaces (50 workers and under) but there was little difference between the public and private sectors.
Risk assessments for new and expectant mothers
Since the last survey, the HSE guidance on protecting new and expectant mothers has been revised to make clear that employers must carry out an individual risk assessment covering a worker’s specific needs when they inform their employer in writing that they are pregnant, have given birth in the last six months or are currently breastfeeding. The employer must assess and control the risks posed by working conditions and processes in each case.
This year’s survey asked respondents whether their workplace had put in place any individual risk assessments for pregnant workers; 61 per cent said they had, 7% said they had not, 22 per cent did not know and 11 per cent said it did not apply as there had been no pregnant workers.
Not surprisingly, the likelihood that workplaces have had any risk assessments is higher the larger the workplace, as they are more likely to have had some new or expectant workers in the period covered. The assessments have been more prevalent in the public sector (64 per cent had done them) than in the private sector (57 per cent), but again that is largely because more in the private sector have had no pregnant workers.
Safety reps were also asked if their workplace had put in place individual risk mitigation for pregnant workers. The figures here were 49 per cent saying yes, 7 per cent no and 11 per cent again saying there had been no pregnant workers. One in three (33 per cent) did not know if there had been risk mitigation.
Safety reps’ involvement in the risk assessment process
The Health and Safety at Work Act 1974 and the Safety Representatives and Safety Committees Regulations 1977 require that employers consult with recognised trade union safety representatives on health, safety and welfare matters.
However, many safety representatives still say they are not consulted over risk assessments. Survey participants were asked if they or other safety reps had been involved in their employer’s risk assessment(s). The key findings are below (with the 2020/21 equivalent figures in brackets) and it seems there has been no improvement in this area in the last two years:
- Just 17 per cent said safety reps had been fully involved (15 per cent), with another 15 per cent involved “a lot” (18 per cent);
- 33 per cent said safety reps had been involved “a little” (33 per cent); and
- 29 per cent said safety reps had not been involved at all (27 per cent).
The rest did not know if safety reps had been involved.
Employer provision of occupational health services
Occupational health (OH) schemes give access to a range of professional advice and services to employees, and 94 per cent of safety representatives said that their employers provide some sort of OH service – slightly more than the 92 per cent saying so in 2020/21.
The figures were 96 per cent in the public sector, 92 per cent in the private sector and 87 per cent in the voluntary/not-for-profit sector.
The balance between in-house provision and use of external services has only changed very slightly, after a substantial fall in in-house provision between 2018 and 2020/21. The proportion of all respondents whose employer had in-house OH provision was 34 per cent (32 per cent in 2020/21), while 60 per cent of all reps had OH provided via an external service.
That small increase in in-house provision come from the public sector, where 37 per cent of respondents said there is in-house provision compared with 33 per cent two years ago. The balance in the private sector barely changed, with 31 per cent reporting in-house provision in both surveys.
Table 7: Occupational health provision by sector (2020/21 figures)
|
Public sector |
Private sector |
|
|
yes – in house |
37% (33%) |
31% (31%) |
|
yes – external provider |
59% (60%) |
61% (60%) |
The prevalence of OH provision in each industry, and how it compares with two years ago, can be seen in table 8. There appears to have been a substantial improvement in education and to a lesser extent in distribution, manufacturing and construction. The opposite is true in agriculture and fishing, leisure and hospitality (although in some case these figures are based on small samples).
Table 8: Provision of OH services by industry
|
2022/23 |
2020/21 |
|
|
Energy and water |
100% |
100% |
|
Local government |
99% |
98% |
|
Health services |
97% |
98% |
|
Manufacturing |
97% |
93% |
|
Central government |
96% |
99% |
|
Education |
94% |
85% |
|
Transport and communications |
94% |
93% |
|
Other services |
93% |
91% |
|
Distribution |
91% |
85% |
|
Voluntary/not-for profit sector |
91% |
88% |
|
Banking, insurance and finance |
88% |
88% |
|
Hospitality |
85% |
100%* |
|
Construction |
84% |
76% |
|
Leisure services |
83% |
91% |
|
Agriculture and fishing |
75% |
100% |
|
Entertainment |
64% |
n/a** |
*This was defined as hotels and restaurants in 2020/21 and figure was based on only one representative. **This category was not included in 2020/21.
Managing Covid-19
The 2020/21 survey was conducted in the depths of the Covid-19 pandemic and, while the situation is vastly different now, the impact of the virus has not gone away. This year’s survey therefore asked safety representatives about how that impact was being managed in their workplace.
While half of respondents (50 per cent) said their employer has monitored and improved ventilation in controlling the risk of exposure to Covid-19 and other airborne viruses, more than one in three (36 per cent) said they have not. Of reps from the largest workplaces (those with more than 1,000 workers), 58 per cent said their employer had done this but still 30 per cent had not.
Private sector respondents were significantly less likely than those other sectors to say their employer had monitored and improved ventilation.
Table 9: Ventilation monitored and improved by economic sector
|
Public sector |
Private sector |
Not-for-profit/ voluntary sector |
All |
|
|
yes |
55% |
44% |
62% |
50% |
|
no |
31% |
43% |
28% |
36% |
|
don't know |
14% |
12% |
10% |
14% |
Table 10 shows there is considerable variation in the rate of monitoring and improving ventilation between industries, with construction being most likely to do this. It is quite shocking that fewer than half of respondents say their employer has done this in health services, hospitality, transport and communications, distribution and other services.
Table 10: Ventilation monitored and improved by industry
|
Yes |
No |
Don't know |
|
|
Construction |
71% |
26% |
3% |
|
Agriculture and fishing |
63% |
38% |
- |
|
Banking, insurance and finance |
63% |
22% |
15% |
|
Voluntary/not-for profit sector |
62% |
26% |
12% |
|
Education |
62% |
30% |
8% |
|
Local government |
61% |
25% |
14% |
|
Central government |
61% |
30% |
9% |
|
Energy and water |
59% |
27% |
14% |
|
Leisure services |
58% |
42% |
- |
|
Entertainment |
56% |
30% |
15% |
|
Manufacturing |
51% |
39% |
10% |
|
Health services |
48% |
33% |
19% |
|
Hospitality |
45% |
40% |
15% |
|
Transport and communications |
43% |
46% |
11% |
|
Distribution |
41% |
46% |
13% |
|
Other services |
40% |
38% |
22% |
Safety representatives were asked about incidence of workers with Long Covid. A massive two out of every three workplaces represented in the survey (66 per cent) have seen workers experiencing Long Covid.
Table 11 sets out the extent to which employer support has been provided to workers with Long Covid. While 61 per cent said Long Covid sufferers have been offered a phased return to work, and 60 per said that sick pay has been paid during their absence, just 43 per cent have had flexible work options and 29 per cent changes to their duties. Only 13 per cent said physical changes have been made to the workplace.
Table 11: Workplaces providing support for workers with Long Covid
|
Occupational Health referrals |
65% |
|
Phased return to work |
61% |
|
Sick pay during absence |
60% |
|
Flexible work options |
43% |
|
Home working |
32% |
|
Changes to job/duties |
29% |
|
Longer/more frequent breaks |
20% |
|
Physical changes to the workplace |
13% |
There is considerable variation between industries in the prevalence of some of these facilities for workers with Long Covid. Provision of flexible working was reported by two in three reps in agriculture and fishing (though this is based on a very small sample of respondents) and those in banking, insurance and finance – but just 29 per cent of reps in hospitality and 13 per cent in leisure services.
Table 12: Reps reporting flexible working available to workers with Long Covid
|
Agriculture and fishing |
67% |
|
Banking, insurance and finance |
66% |
|
Central government |
63% |
|
Health services |
57% |
|
Voluntary/not-for profit sector |
54% |
|
Local government |
46% |
|
Education |
43% |
|
Entertainment |
40% |
|
Other services |
39% |
|
Energy and water |
38% |
|
Construction |
38% |
|
Distribution |
34% |
|
Transport and communications |
34% |
|
Manufacturing |
30% |
|
Hospitality |
29% |
|
Leisure services |
13% |
One in 10 safety reps (11 per cent) said there has been strong evidence that a Covid-19 death was linked to workplace exposure, with 51 per cent saying there has not and 38 per cent saying they do not know.
The industries where safety representatives are most likely to say that there had been strong evidence of a Covid-19 death linked to workplace exposure are agriculture and fishing (again based on a very small sample) and – not surprisingly - health services (see table 13).
Table 13: Covid death possible linked to workplace exposure by industry
|
Agriculture and fishing |
38% |
|
Health services |
28% |
|
Hospitality |
15% |
|
Transport and communications |
14% |
|
Voluntary/not-for profit sector |
12% |
|
Local government |
12% |
|
Entertainment |
11% |
|
Construction |
11% |
|
Distribution |
10% |
|
Leisure services |
8% |
|
Central government |
7% |
|
Education |
6% |
|
Other services |
6% |
|
Energy and water |
5% |
|
Manufacturing |
5% |
|
Banking, insurance and finance |
4% |
Reps suspecting a workplace linked death from Covid-19 were asked if the employer reported the death to the HSE or relevant regulator. Only one in three (34 per cent) said they had, although 52 per cent did not know. Where that did happen, 47 per cent of respondents said the regulator also contacted safety reps.
Section 4: Rights of health and safety representatives
Safety representatives have wide-ranging rights and powers under the Safety Representatives and Safety Committees Regulations 1977 and other health and safety legislation. The TUC survey asked safety representatives about the extent to which they have been able to exercise these rights and powers.
Training
The survey asked survey participants about the range of training they have received as a health and safety rep. The responses are set out in Table 14, together with comparisons with the survey of two years ago. It should be noted that the question refers to health and safety training received by the respondent at any point, not just in the period covered by the survey.
Table 14: Training received by survey respondents
|
2022/23 |
2020/21 |
|
|
TUC Education Stage 1 |
40% |
44% |
|
TUC Education Stage 2 |
28% |
28% |
|
Course provided by your union |
63% |
57% |
|
Course provided by employer |
16% |
13% |
|
Joint union-employer course |
7% |
6% |
|
TUC Diploma/Certificate in OSH |
15% |
15% |
|
Another health and safety course |
18% |
18% |
|
No health and safety training |
6% |
8% |
The most common form of training received is one provided by their own union, and the figure saying they have received this has risen since 2020/21 from 57 per cent to 63 per cent. This may reflect the increased efforts by many unions during the Covid-19 pandemic to provide more health and safety courses for their reps – and perhaps more online courses.
The next most widespread training is the Stage 1 and Stage 2 TUC Education courses, although the proportion indicating they have been through Stage 1 is slightly lower than in the last survey.
A slightly higher proportion than two years ago have received a course provided by their employer or their employer jointly with their union.
Table 15: Training received by time as safety representative
|
Less than 1 year |
1-5 years |
5-10 years |
Over 10 years |
|||
|
TUC Education course Stage I |
29% |
39% |
40% |
52% |
||
|
TUC Education course Stage 2 |
10% |
22% |
32% |
46% |
||
|
Course provided by your union |
53% |
60% |
69% |
71% |
||
|
Course provided by employer |
6% |
12% |
19% |
25% |
||
|
Joint union-employer course |
2% |
5% |
8% |
11% |
||
|
TUC certificate in Occupational Safety and Health |
5% |
10% |
17% |
26% |
||
|
Another health and safety course |
7% |
15% |
19% |
28% |
||
|
I have not received any health and safety training |
18% |
5% |
2% |
2% |
||
The vast majority of safety representatives of all levels of experience have had some health and safety training, most commonly from their union or from TUC Education. Indeed the proportion of the newest of safety reps (in post for under one year) who have not had any training has fallen since the last survey, when 23 per cent said they had not received any, compared with 18 per cent this time around. This is largely down to an increase, from 42 per cent to 53 per cent, of new reps having been through courses provided by their union.
Time off for training
The regulations and subsequent court cases have established the right of safety representatives to time off for training. However, 28 per cent of all respondents to the survey said there have been times when they have been unable to take up training courses. This compares with 30 per cent in 2020/21.
Reps were asked for the reasons they could not take up courses. Forty per cent of reps who said there had been times when they could not attend said the reason (or one of the reasons) was “I was too busy at work” (accounting for 11 per cent of all respondents to the survey). The next most prominent reason was “because my employer refused time off”, cited by 31 per cent (nine per cent of all respondents).
Time and/or location of the course was a reason mentioned by 25 per cent (seven per of all respondents) and family responsibilities by 13 per cent (four per cent of all respondents). Two other reasons given were health or disability-related barriers and a lack appropriate technology or IT skills to access the training, cited in each case by five per cent (two per cent of all respondents).
Consultation in “good time”
Safety representatives have the right to be consulted on health, safety and welfare matters by their employer. The survey asked respondents to select which of three descriptions about how their employer consults with them most closely fitted their experience, with the following results:
- 42 per cent said “my employer consults me/my union on a regular scheduled basis AND when urgent issues arise”;
- 20 per cent said “my employer consults me/my union whenever urgent issues arise BUT NOT on a regular scheduled basis”; and
- 30 per cent said “my employer consults me/my union infrequently/only when I/my union raise(s) issues with them”.
These responses are virtually unchanged on those for 2020/21.
There are substantial variations between different industries in the level of regular scheduled consultation between employer and union. The worst in this regard are hospitality, health services, leisure services and entertainment.
Table 16: Level of employer consultation with safety representatives by industry
|
|
Scheduled AND urgent |
Urgent NOT scheduled |
Infrequent NOT scheduled |
|
Energy and water |
60% (48%) |
14% |
20% |
|
Banking, insurance and finance |
57% (64%) |
9% |
27% |
|
Manufacturing |
53% (39%) |
18% |
26% |
|
Construction |
53% (53%) |
18% |
21% |
|
Agriculture and fishing |
50% (44%) |
25% |
25% |
|
Local government |
47% (61%) |
18% |
27% |
|
Central government |
46% (45%) |
23% |
27% |
|
Transport and communications |
45% (49%) |
21% |
29% |
|
Distribution |
44% (39%) |
20% |
31% |
|
Voluntary/not-for profit sector |
41% (25%) |
26% |
18% |
|
Education |
41% (39%) |
18% |
36% |
|
35% (na) |
20% |
35% |
|
|
Health services |
33% (35%) |
22% |
30% |
|
Leisure services |
33% (14%) |
- |
58% |
|
Other services |
31% (37%) |
22% |
34% |
|
Entertainment |
21% (na) |
25% |
36% |
Compared with two years ago, the picture in some industries has improved. These include energy and water, manufacturing, distribution and leisure services. But in others, such as banking, insurance and finance, local government and other services, it is worse.
Employers are more likely to conduct regular scheduled consultation where they have more than 200 workers. However, even in establishments with more than 1,000 staff, only 53 per cent say their employer consults with the union on a regular scheduled basis, with another 17 per cent saying they do so when urgent issues arise but not on a scheduled basis.
Inspections
One of the important rights that safety representatives have is the right to inspect the workplace, allowing them to identify hazards and highlight action to be undertaken by management. The Approved Code of Practice states that they can inspect every three months, or more frequently by agreement, so long as they notify the employer in writing.
The survey found that one in four safety representatives (26 per cent) had not conducted any inspections in the past 12 months – the same proportion as in the 2020/21 survey. A higher proportion than two years ago had conducted five or more inspections – perhaps because inspections in many industries would have been affected by Covid-19 lockdowns.
16 per cent had conducted one inspection (20 per cent in 2020/21);
13 per cent had conducted two inspections (14 per cent in 2020/21);
20 per cent had conducted three to four inspections (20 per cent in 2020/21); and
21 per cent had conducted five or more inspections (17 per cent in 2020/21).
The more experienced the rep, the more likely they are to carry out more frequent inspections. Just over half (51 per cent) of those with over five years’ experience have carried out three or more inspections in the last 12 months (more than the 47 per cent who said this in 2020/21). That compares with 36 per cent of representatives with one to five years’ experience (the same proportion as in 2020/21). Among those in post for less than a year, just 26 per cent had conducted three or more inspections. But this is a rise compared with 15 per cent two years ago during the pandemic, and back to the level of 2018.
Time spent on safety representatives’ duties
Survey respondents were asked how much time they spend specifically on health and safety matters in an average week. The majority spend less than five hours, but a small proportion spend more than 20 hours (This issue cannot be directly compared with previous surveys as the topic was explored differently.)
37 per cent spend an hour or less;
36 per cent spend between one and five hours;
9 per cent spend between five and 10 hours;
3 per cent spend between 10 and 20 hours;
2 per cent spend over 20 hours; and
4 per cent are on full-time release.
Paid time off for safety duties
More than three quarters of respondents (77 per cent) said they get paid time away from their job responsibilities to carry out their role as a rep. The proportion is 72 per cent among those who are solely health and safety representatives and 80 per cent among those who are a workplace representative/shop steward as well as a health and safety rep.
Of those who do get paid time off:
17 per cent get an hour or less per week;
30 per cent get one to five hours per week;
11 per cent get five to 10 hours per week;
7 per cent get 10–20 hours per week;
4 per cent get over 20 hours per week; and
16 per cent are on full-time release.
Those who are solely health and safety representatives are more likely to be clustered at the lower end of the paid time off range (five hours and under), and just 12 per cent are on full-time paid release, compared with 17 per cent of those who are also workplace reps/shop stewards.
Joint union-management committees
The work of joint union-management health and safety committees is a key factor in making safety representatives’ work effective. However, one in five respondents (21 per cent) said that there is not a joint committee where they work – albeit this is a slightly lower percentage than in 2020/21 (23 per cent).
Seventy-three per cent of survey respondents said there is a safety committee. Of these, 76 per cent meet regularly - a slightly higher proportion than the 73 per cent in 2020/21 – possibly again the effect of no Covid lockdowns this time.
Overall, 55 per cent of workplaces covered by the survey have a union-management safety committee that meets regularly. The proportion that does so varies considerably according to the size of the workplace, with those with over 200 employees much more likely to have a committee.
Table 17: Proportion with safety committees meeting regularly by workplace size
|
Number of workers |
Committee that meets regularly |
|
fewer than 5 |
33% |
|
6-50 |
35% |
|
51--100 |
40% |
|
101-200 |
38% |
|
201-1,000 |
56% |
|
1,001 or more |
73% |
Safety representatives in the public sector are slightly more likely to have joint committees meeting regularly than those in the private sector (57 per cent compared with 54 per cent), while 50 per cent of those in the voluntary/not-for-profit sector have them.
The industries most likely to have joint union-management safety committees meeting regularly are agriculture and fishing, energy and water and construction. Those least likely to are entertainment, other services and hospitality.
Table 18: Proportion with safety committees meeting regularly by industry
|
Agriculture and fishing |
88% |
|
Energy and water |
78% |
|
Construction |
68% |
|
Manufacturing |
67% |
|
Central government |
67% |
|
Health services |
62% |
|
Transport and communications |
61% |
|
Local government |
60% |
|
Voluntary/not-for profit sector |
59% |
|
Leisure services |
58% |
|
Distribution |
56% |
|
Education |
52% |
|
Banking, insurance and finance |
49% |
|
Entertainment |
36% |
|
Other services |
33% |
|
Hospitality |
15% |
Sources of information and support
Safety representatives were asked what sources of information they regularly use to update their knowledge and understanding. The most commonly used sources were their union’s own website or newsletters, with nearly all respondents (94 per cent) saying they used these either “often” (57 per cent) or “occasionally” (37 per cent).
In addition, most (88 per cent) said they used information from their employer, 84 per cent the HSE website and 84 per cent the TUC website/materials (Table 19).
Table 19: Information sources used
|
|
Often |
Occasionally |
|
|
Your union website/newsletters |
57% |
37% |
|
|
Your employer |
43% |
45% |
|
|
HSE website/newsletters |
38% |
46% |
|
|
TUC website/materials |
30% |
54% |
|
|
TUC Risks e-newsletter |
26% |
37% |
|
|
Hazards magazine/website |
25% |
37% |
|
|
Labour Research Department website/publications |
17% |
34% |
|
|
Sector press/website |
14% |
43% |
|
|
Other |
14% |
26% |
|
Section 5: Enforcement
The survey asked about visits by health and safety inspectors, be they HSE inspectors, Environmental Health Officers or other relevant safety inspectors (such as from the Railways Inspectorate).
The responses indicate that six in 10 safety representatives did not know of any visit ever having been made by the relevant safety inspectorate. This was split between 17 per cent saying there had never been one and 43 per cent who did not know if there had.
A slightly smaller proportion than in the last survey said there had been an inspection “within the last 12 months”.
- 22 per cent of safety representatives said that their workplace had been inspected within the last 12 months (compared with 24 per cent in 2020/21 and 22 per cent in 2018);
- 11 per cent said the last inspection was between one and three years ago (compared with 10 per cent in 2020/21 and 16 per cent in 2018);
- 7 per cent said it was over three years ago (compared with 6 per cent in 2020/21 and 11 per cent in 2018);
- 17 per cent said there had never, as far as they know, been an inspection, with another 43 per cent saying they did not know if there had been. (In 2020/21, 22 per cent said there had never been an inspection and 39 per cent did not know).
Inspections were more likely to have taken place in the last year in the private sector than in the public sector (25 per cent compared with 20 per cent).
Representatives from the largest workplaces (over 1,000 employees) and the smallest (under five) were more likely than others to have seen an inspection in the last year (25 per cent had done so in each case). Among workplaces between those sizes, 18-21 per cent had seen an inspection in the last 12 months.
Table 20: Last inspection by HSE or relevant inspectorate, by industry
|
Within the last 12 months |
Never, as far as you know |
Don't know |
|
|
Agriculture and fishing |
50% |
25% |
- |
|
Construction |
47% |
11% |
24% |
|
Manufacturing |
45% |
5% |
27% |
|
Hospitality |
35% |
5% |
40% |
|
Leisure services |
33% |
25% |
42% |
|
Energy and water |
33% |
10% |
48% |
|
Distribution |
24% |
19% |
41% |
|
Health services |
22% |
11% |
46% |
|
Local government |
20% |
17% |
43% |
|
Other services |
19% |
16% |
49% |
|
Education |
18% |
22% |
42% |
|
Voluntary/not-for profit sector |
15% |
21% |
44% |
|
Banking, insurance and finance |
14% |
33% |
45% |
|
Transport and communications |
14% |
22% |
48% |
|
Entertainment |
14% |
21% |
54% |
|
Central government |
10% |
37% |
40% |
There are no industries where a majority of safety representatives said there had been an inspection in the last 12 months (Table 0). The industry most likely to have done so was agriculture and fishing (though there were only eight respondents from this sector), followed by construction.
There appears to have been a slight improvement in the construction industry, where 47 per cent said there had been an inspection in the last 12 months, compared with 41 per cent in 2020/21, and just 11 per cent said there had never been one, as far as they knew (compared with 29 per cent). The picture in other services, however, seems to have moved in the opposite direction, with just 19 per cent saying there had been an inspection in the last 12 months compared with 25 per cent two years ago. Again, these changes may have been affected by the Covid-19 pandemic.
The respondents most likely to say their workplace had never, to their knowledge, had an inspection were those from the central government, banking, insurance and finance, agriculture and fishing and leisure services.
Inspectors and safety representatives
Contact between safety representatives and inspectors is scarce, according to the survey.
Of those who could recall an inspection at all, fewer than half (46 per cent) said they or other safety reps had been notified of the visit before it took place – a figure virtually unchanged since the last survey (45 per cent).
As in 2020/21, only 36 per cent of them said they or another safety representative had spoken with the inspector on their most recent visit. (Percentage figures mentioned in the 2020/21 report were of all respondents to the survey.)
Improvements and enforcement action
The survey asked safety representatives whether their employers had made improvements to health and safety management – either because of the possibility of a visit by inspectors, or because of enforcement action taken against other employers, such as a notice or prosecution.
Table 21: Improvements because of the possibility of a visit
|
|
2022/23 |
2020/21 |
2018 |
2016 |
2014 |
2012 |
|
Not at all |
16% |
14% |
17% |
22% |
19% |
26% |
|
A little |
18% |
20% |
19% |
19% |
16% |
18% |
|
Somewhat |
20% |
21% |
21% |
16% |
20% |
15% |
|
A lot |
14% |
14% |
15% |
17% |
16% |
20% |
|
Don’t know |
31% |
32% |
28% |
26% |
29% |
22% |
Table 22 indicates the extent to which safety representatives felt employers had made health and safety improvements because of the possibility of an inspection. The results suggest that that only a minority of respondents (34 per cent) felt their employer had made anything more than “a little” improvement – almost the same as two years ago.
The survey also asked safety representatives whether their employer had, in the last two years, made improvements to health and safety after hearing about an enforcement notice or prosecution of another organisation. Fewer than one in four (23 per cent) said they had, although most did not know.
Table 22: Improvements after hearing about a notice or prosecution
|
|
2022/23 |
2020/21 |
2018 |
2016 |
2014 |
2012 |
|
Yes |
23% |
25% |
22% |
22% |
23% |
27% |
|
No |
25% |
25% |
23% |
31% |
29% |
26% |
|
Don’t know |
52% |
50% |
55% |
47% |
48% |
47% |
The survey went on to ask safety representatives about actual notices served. Only 13 per cent of safety representatives said their employers have at some point received a legal enforcement notice – a much smaller proportion than the 18 per cent of two years ago. (However, 58 per cent did not know, compared with 55 per cent in 2020/21.)
This group were asked about their employer’s response to the most recent enforcement notice.
First, they were asked if they or other safety representatives had been involved in taking steps to make improvements to comply with the notice.
- 44 per cent said they or other safety reps knew about the notice and were consulted on improvements to comply with it;
- 28 per cent said they or other safety reps knew about the notice but were not consulted on improvements to comply with it; and
- 11 per cent said they or other reps did not know about the notice and were not consulted on improvements to comply with it. Another 17 per cent said they didn’t know.
Secondly, where there had been at least one notice issued, safety representatives were asked about the extent of their employer’s response to the (most recent) notice. The results are set out below in order of declining thoroughness of employer response:
- 37 per cent of respondents said they complied with the notice and also reviewed other practices in different departments;
- 10 per cent said they implemented best practice and the effect has lasted for at least several months but only in one work activity or area;
- 12 per cent said they implemented best practice but the effect was short term and only affected one work activity or area; and
- 31 per cent said they did the minimum they could to comply with the notice.
Stay Updated
Want to hear about our latest news and blogs?
Sign up now to get it straight to your inbox