Jobs and Recovery Monitor - BME workers
In our latest recession report, we begin by looking at how the pandemic is impacting employment, unemployment and redundancies. There are clear signs in the latest labour market data of the negative impact: a record rise in unemployment and a record number of redundancies.
We then look at racial inequalities in the labour market, with a particularly focus on how the already-high BME unemployment rate has increased since the start of the pandemic. A breakdown of BME employment by industry shows early evidence of large falls in the number of BME workers in industries hit hard by the pandemic, especially when compared to the fall in the number of white employees within these industries.
Download full analysis (PDF)
Job losses since the start of the pandemic
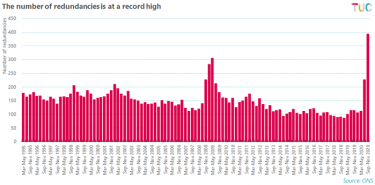
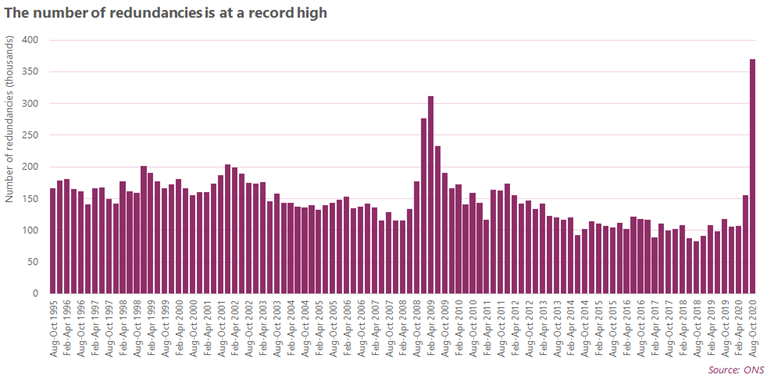
Redundancies
The latest labour market data[1] shows the continuing impact of the pandemic on jobs and unemployment. Some new records have been set, none of them good. Redundancies have hit a record high, with 370,000 reported in Aug-Oct 2020. This is a 212 per cent increase on the same period a year ago (another record), and is 58,000 higher than any three-month period during the financial crisis.
Employment and unemployment
We also saw the largest quarterly rise in unemployment on record. In Aug-Oct 2020, the number of people unemployed leapt up by 241,000 people (16.6 per cent). This means the unemployment rate is now 4.9 per cent, compared to 3.9 per cent in Nov-Jan 2020[1]. This equates to 1.69 million people unemployed. The employment rate has fallen from 76.5 per cent to 75.2 per cent across the same period.
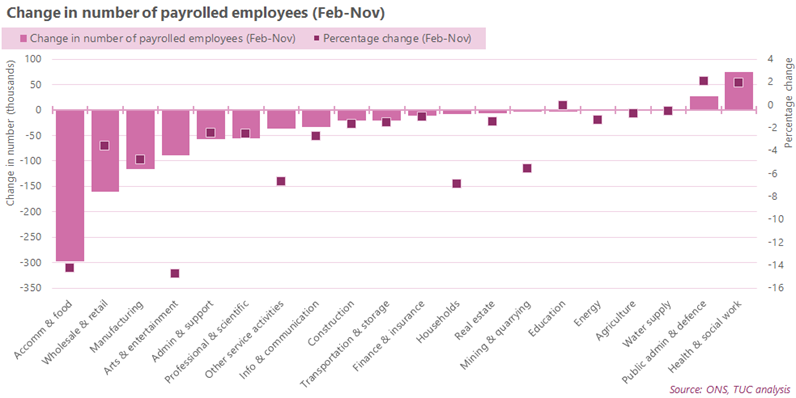
Job losses by industry
The Office of National Statistics (ONS), alongside its usual labour market release, also provides a flash estimate of the number of payrolled employees based on Pay As You Earn data[2].
According to this estimate, 819,200 jobs have been lost between February and November 2020. This equates to a 2.8 per cent fall. Job losses have been concentrated in a handful of industries, with three industries accounting for 70 per cent of job losses: accommodation and food (297,000), wholesale and retail (160,000) and manufacturing (115,000).
Racial inequalities in the labour market
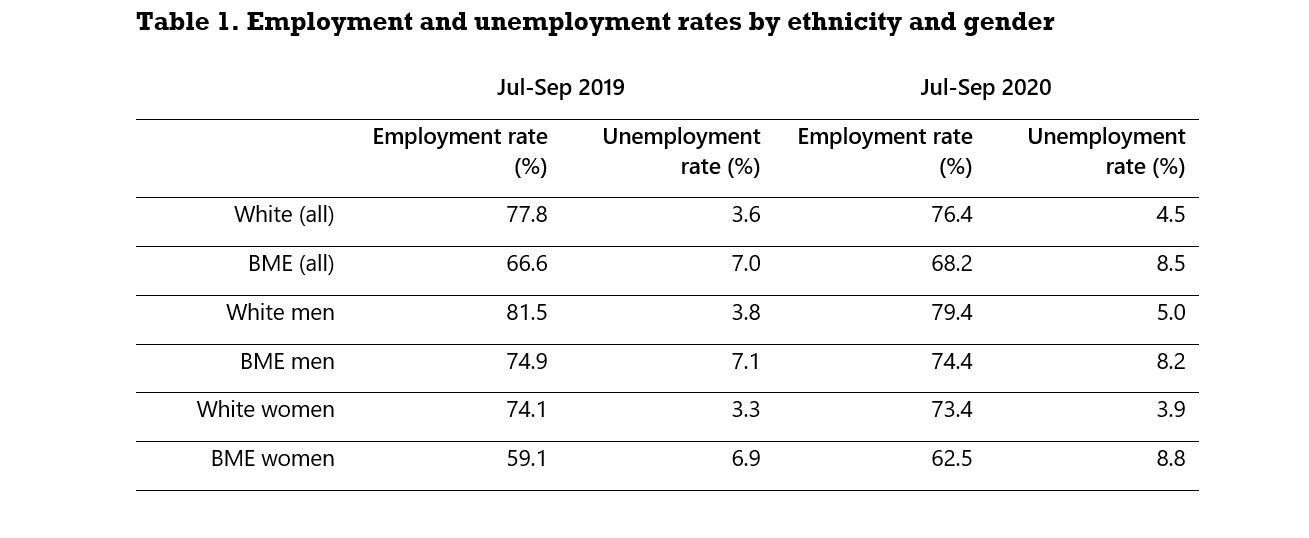
With unemployment rising, it’s important to note the disparities in the unemployment rate by ethnicity. Unemployment is expected to continue to rise, with the OBR forecasting the unemployment rate to peak at 7.5 per cent next year[1]. The BME unemployment rate is already above this, and was close to it before the pandemic hit. In Q3 2019[2], the unemployment rate for white people was 3.6 per cent, while the BME unemployment rate was 7.0 per cent. A year later, this has grown to 4.5 per cent for white people and 8.5 per cent for BME people.
Racial inequalities intersect with gender inequalities, with BME women having both the highest rate of unemployment (8.8 per cent) and the lowest rate of employment (62.5 per cent).
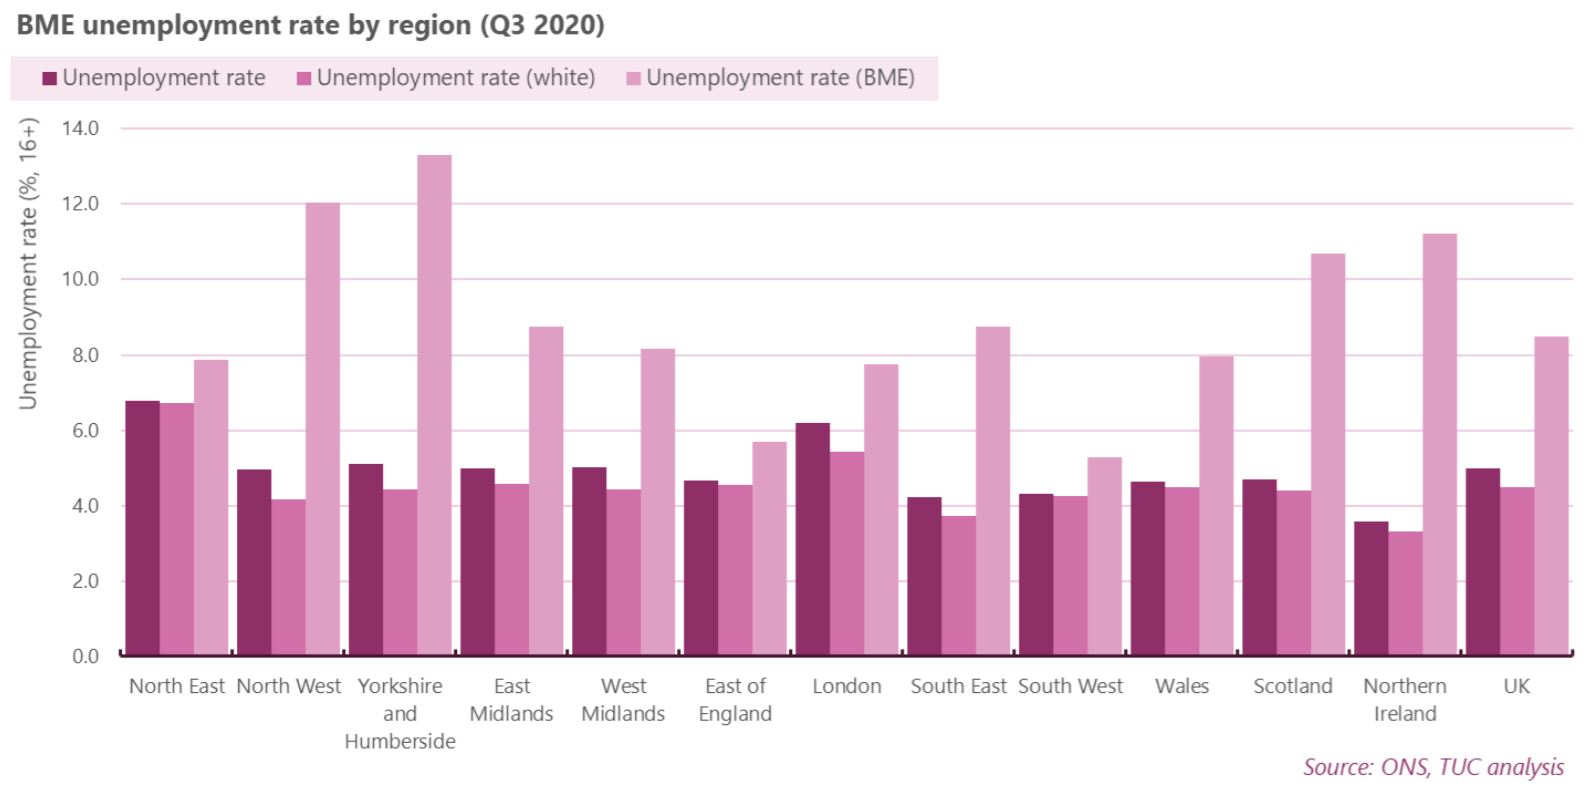
The BME unemployment rate varies by region, but in every region, it is higher than the unemployment rate for white people. Yorkshire and Humberside and the North West have the highest rates (13.3 per cent and 12.1 per cent respectively).
Employment by industry
There’s some evidence that industries hit hard by the pandemic have already seen large falls in the number of BME workers, especially when compared to the fall in the number of white employees within these industries.
The number of BME workers in employment fell by 5.3 per cent between Q3 2019 and Q3 2020, compared to a fall of just 0.2 per cent in the number of white workers.
A breakdown by industry shows that between Q3 2019 and Q3 2020:
- The number of BME workers in the accommodation and food sector has dropped by 23 per cent, with the largest fall among BME men
- The number of BME women working in the arts and entertainment sector has fallen by 44 per cent across the period
- The numbers of BME workers in the wholesale and retail industry and construction industry have fallen by 16 per cent and 14 per cent respectively
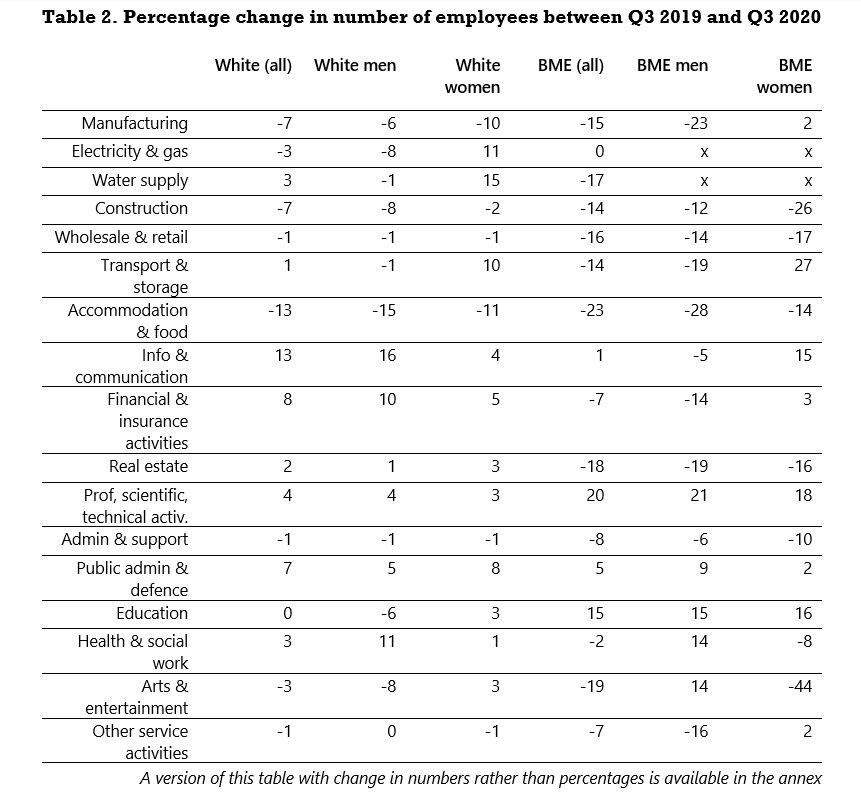
There has been growth in BME employment in a few industries. Education and the professional, scientific and technical industries have both seen significant increases in the number of BME employees. In both, there has been higher growth in the number of BME workers than there has in the number of white workers. However, these are two of only three industries where this is the case (the third is electricity and gas, where the number of BME workers hasn’t grown, but the number of white workers has slightly fallen).
In most industries, the number of BME workers fell while the number of white workers either fell by a much smaller percentage or grew.
Part-time and full-time employment
BME workers have also been disproportionately impacted by one of the clear trends from the change in the number of workers between Q3 2019 and Q3 2020: the drop in the number of part-time workers.
The number of part-time BME workers has fallen by 15 per cent, or 163,000 people. This has not been counteracted by a rise in full-time work, as the number of full-time BME workers has fallen by around 49,000 people (although there has been a rise in full-time employment among BME women).
The number of part-time white workers has also fallen, but to a much lesser extent (4 per cent, compared to 15 per cent). And the number of full-time white workers has slightly increased.

Why is employment falling but the employment rate rising?
The data shows a significant fall in employment levels, especially in certain industries. However, as shown above, the BME employment rate has risen compared to last year.
The employment rate is the number of people aged 16-64 who are employed as a percentage of the entire population of 16-to-64 year olds. In Q3 2020, the number of BME people employed dropped drastically, falling by 222,000. However, the overall BME population fell too, by 463,000.
We are therefore concerned about what these statistics show for two reasons. Firstly, there’s the concerning drop in employment among BME people outlined above. Secondly, the statistics don’t offer a full explanation about what happened to these workers after they left their jobs. Given the rise in the number of BME people unemployed, some will have entered unemployment (which increased by 49,000 people across the period). It would be expected that others will have become ‘economically inactive’, people who are not working but also not unemployed as they’re either not looking for work, or unable to work. However, the number of economically inactive BME people has dropped by 17 per cent or 290,000 people.
Overall, the BME population as measured in these statistics has fallen by 8 per cent. That’s almost half a million BME people suddenly missing from the statistics. This means it is harder to understand what is driving the employment changes among BME people, and their extent. The unemployment rate isn’t as affected by this population change, as this is calculated differently.
The unemployment rate is the number of people unemployed as a percentage of the ‘economically active’ population (those in employment plus those who are unemployed). As set out above, the BME unemployment rate in Q3 2020 was 8.5 per cent - which is already higher than the peak overall unemployment rate forecasted by the OBR.
Youth unemployment by ethnicity
In Q3 2020, the youth unemployment rate (16-24) among BME people was 26 per cent, compared to 15 per cent among white people. This tells us that BME young people who choose to work, rather than study, have a more difficult time in the labour market than their white peers.
However, this does not tell the whole story. Unemployment rates are calculated by finding the number of people unemployed as a percentage of those who are economically active (which is the number of people employed plus the number of people actively seeking and available to work). This exclude students who are outside the labour market.
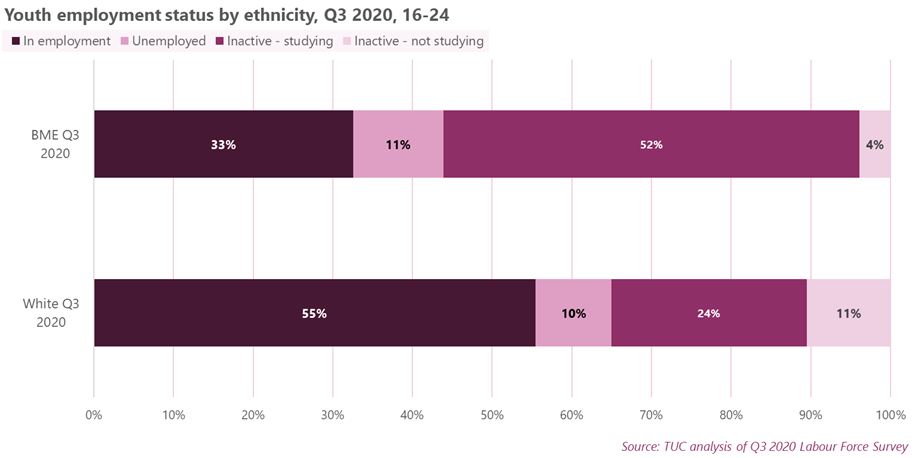
The chart below shows employment status for those aged 16-24. It’s clear that the BME youth unemployment rate is particularly high because young BME people are more likely to be studying, with around half of young BME workers being ‘inactive’ due to being a student and therefore not included in the unemployment rate calculation.
The percentage of all young BME people who are unemployed is, however, still slightly higher than it is for young white people (11 per cent compared to ten per cent). The reasons for this are complex but it’s worth noting that BME workers are more likely to be unemployed than white workers at every qualification level[1].
The number of people unemployed has risen for both BME and white young people since the start of the pandemic. In Q4 2019, around 7 per cent of all young white people and 8 per cent of all young BME people were unemployed.
Insecure work and underemployment
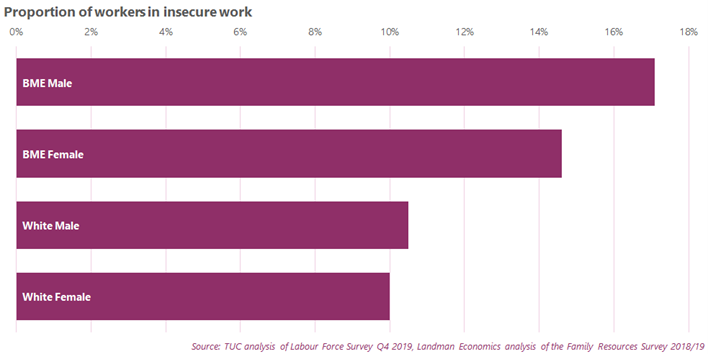
For BME workers, research carried out before the pandemic shows that work is more likely to be insecure. Analysis of insecure work in Q4 2019 and low-paid self-employment in 2019 shows that 17 per cent of BME male workers and 15 per cent of BME female workers are in insecure work, compared to 11 per cent of white male workers and ten per cent of white female workers[1].
BME workers are also more likely than white workers to be underemployed, with 12 per cent of BME workers underemployed, compared to 9 per cent of white workers. Underemployed workers are those who are working part-time but would like to work full-time, and those who would like more hours in their current job[2].
Taking action on institutional and systemic racism
The pandemic has disproportionately impacted BME people. ONS analysis has shown that BME people are more likely than white people to die from Covid-19, with this being strongly associated with demographic and socio-economic factors, such as place of residences and occupation[1].
Previous TUC research has looked at how the impact of coronavirus on BME people has highlighted multiple areas of systemic and institutional racism, including within the labour market[2].
We reiterate our calls made in that report and call on government to:
- Publish an action plan to tackle the inequalities that BME people face, including in work, health, education and justice
- Introduce mandatory ethnicity pay gap reporting and make employers publish action plans to ensure fair treatment for BME workers in the workplace
- Ban zero-hours contracts, and strengthen the rights of insecure workers
- Publish all the equality impact assessments related to its response to Covid-19 and be fully transparent about how it considers BME communities in its policy decisions
And we call on government to step up efforts to stop unemployment, which has a disproportionate impact on BME workers. This must include providing more support for struggling industries, as well as creating new jobs by investing in jobs in green infrastructure, transport and our public services.
The government must also improve the social safety net for those who do lose their jobs. This requires an urgent overhaul of the benefits system, which must include raising the basic level of Universal Credit and legacy benefits to at least 80 per cent of the national living wage (£260 per week) and scrapping the five-week wait for first Universal Credit payment.
Given the importance of measuring the impact of the pandemic on existing labour market inequalities, we would also like to see labour market data by ethnicity included in the ONS’s monthly labour market release, rather than as a separate quarterly release.
Read all the issues in the Jobs and Recession series
Related reports:
-
Jobs and Recovery Monitor - issue 1
-
Jobs and Recovery Monitor - BME workers - issue 3
-
Jobs and Recovery Monitor - Regions - issue 4
-
Jobs and Recovery Monitor - update on young workers - Issue 5
[1] A01: Summary of labour market statistics, ONS. Available at: https://www.ons.gov.uk/employmentandlabourmarket/peopleinwork/
employmentandemployeetypes/datasets/summaryoflabourmarketstatistics
[2] The unemployment rate is the number of people unemployed as a percentage of the total economically active population (those in work plus those seeking and available to work). It is not the proportion of the total population who are unemployed.
[3] Earnings and employment from Pay As You Earn Real Time Information, UK: December 2020, ONS. Available at: https://www.ons.gov.uk/releases/earningsandemploymentfrompayasyouearnre…
[4] Economic and Fiscal Outlook, November 2020, OBR. Available at: https://obr.uk/efo/economic-and-fiscal-outlook-november-2020/
[5] Source: TUC analysis of the Labour Force Survey Q3 2019 and Q3 2020. This analysis of labour market status by ethnicity is based on Q3 2019/2020 rather than Aug-Oct 2020 as this is the latest available data that can be broken down by ethnicity and allows us to do comparisons to the same period last year.
[6] Barriers young BME workers face in the labour market, TUC (2018), https://www.tuc.org.uk/blogs/barriers-young-bme-workers-face-labour-market
[7] The total number in ‘insecure work’ includes (1) agency, casual, seasonal and other workers, but not those on fixed-term contracts, (2) workers whose primary job is a zero-hours contract, (3) self-employed workers who are paid less than the National Living Wage (£8.72). Data on temporary workers and zero-hour workers is taken from the Labour Force Survey (Q4 2019). Double counting has been excluded. The low-paid self-employment figures come from analysis of data for 2018/19 (the most recent available) in the Family Resources Survey (FRS) and were commissioned by the TUC from Landman Economics.
[8] Based on TUC analysis of Labour Force Survey Q1, Q2 and Q3 2020. To control for double counting our underemployment total includes all of those who would like more hours in their current job, along with all those who are working part-time and would like full-time job but tell LFS researchers that they would not like additional hours in their current post
[9] Updating ethnic contrasts in deaths involving the coronavirus (COVID-19), England and Wales: deaths occurring 2 March to 28 July 2020, ONS. Available at: https://www.ons.gov.uk/peoplepopulationandcommunity/birthsdeathsandmarriages/deaths/articles/updati
[10] Dying on the job – Racism and risk at work, TUC (2020). Available at: https://www.tuc.org.uk/research-analysis/reports/dying-job-racism-and-r…
Stay Updated
Want to hear about our latest news and blogs?
Sign up now to get it straight to your inbox