Seeing the wood for the trees in the latest inflation figures
When it comes to inflation, it’s not always easy to see the wood for the trees.
The Bank of England’s target CPI measure was unchanged in May 2018 at 2.4 per cent. RPI was down 0.1 percentage point (ppt) to 3.3 per cent, and CPIH was up 0.1 ppt to 2.3 per cent. CPIH is the preferred measure of the ONS, but seemingly no one else. Most people tend to use CPI.
The real message behind these figures is that underlying inflationary pressures are still weakening, much more than policymakers expected just a few months ago. In February, the Bank expected inflation to be 2.7 per cent in the second quarter of 2018. That’s not going to happen.
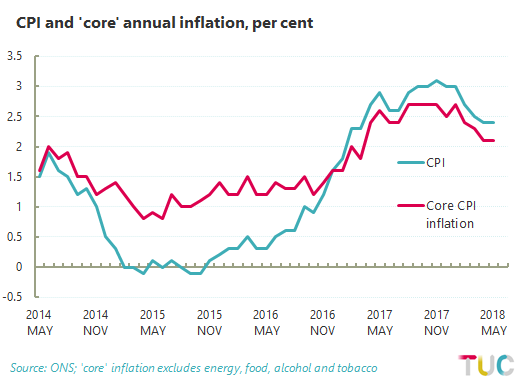
A useful supplementary measure is core inflation, which excludes energy, food, alcohol and tobacco. These items are regarded as erratic and so detract from the ‘underlying pressures’ that economists are most interested in. The chart below therefore compares CPI and core CPI inflation. On both measures inflation is static. At 2.1 per cent, core inflation is pretty much at the Bank’s 2 per cent target (though the target is for CPI not core).
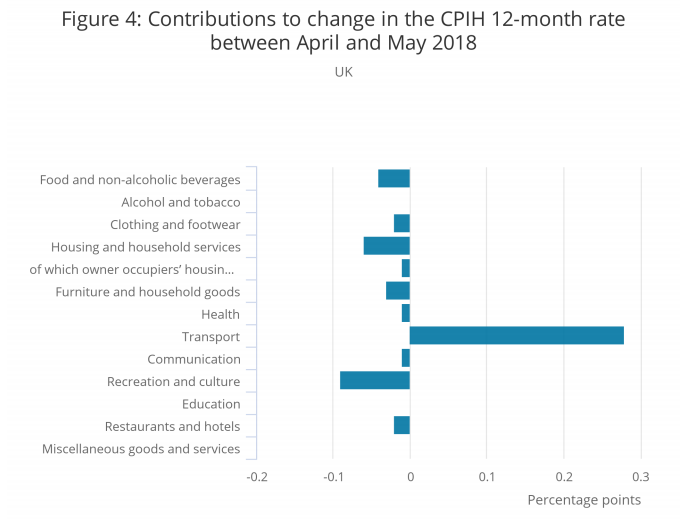
But this ‘static’ story still exaggerates the positives. The details reveal some stark negatives. The most important chart in the ONS release shows every category of goods and services in the negative except for transport (see below).
These are contributions to the change in the headline rate of CPIH, so add up to the 0.1 ppt increase in CPIH between April and May. But the same broad story will be true of all inflation measures: an increase in transport offsetting lower inflation across the board.
Within transport, the critical components are petrol and airfares – shown below:
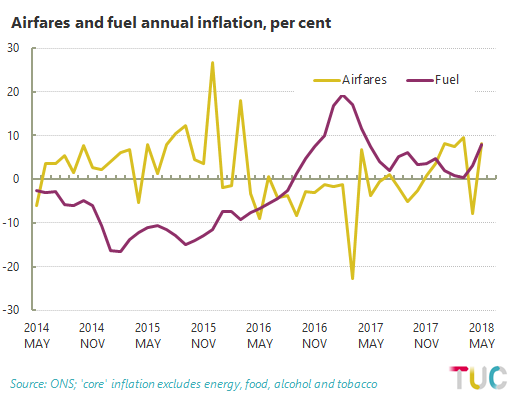
Fuel inflation rose from 3.1 per cent to 8.0 per cent on the month. With a weight of 3 per cent in the overall index, this amounts to an upward movement of 0.15 percentage points [i.e. 3*(8-5)/100].
Airfares rose from -7.9 per cent to 8.2 per cent, even with a smaller weight of ½ per cent this abrupt turnaround (not uncommon for airfares) still means an overall contribution of 0.8 percentage points to the change in headline inflation.
Fuel prices are influenced by much more than domestic considerations, not least the price of oil on international markets and the manoeuvring of those who speculate in these commodity markets (at the moment they’re speculating in the opposite direction). Airfares have been heavily distorted by the timing of Easter.
Core removes fuel inflation, but doesn’t remove airfares. If it did, core would have gone down on the month.
The sum of the parts is weak inflation, with the pressures in the downward direction. Over to Frances O’Grady:
“The case for higher interest rates is falling further away. Instead of an autumn rate rise, we will need an autumn boost in the budget to get the economy moving and wages rising faster.
“Ministers should set up a National Investment Bank, upgrade roads and rail, and bring high-speed broadband and clean energy to every part of Britain.
“We need an end to public service cuts that have hurt schools and hospitals and held back economic growth. And it’s time to give every hard-working public servant a proper pay rise.”
Stay Updated
Want to hear about our latest news and blogs?
Sign up now to get it straight to your inbox