
Industry pay figures offer little encouragement – except in the City
Last week’s labour market statistical release by the Office for National Statistics contained some encouraging news for working people.
They show a welcome growth in real wages for the second successive month, following a year of falling incomes.
Yet they also indicate that real wages remain far below where they were in 2008, and are still falling in almost half of the UK’s industries.
What’s more, there are signs that the brief recovery in wages is already running out of steam, unless you work in finance and real estate.
And since UK workers are still living through the worst wage squeeze in two centuries, it’s clear ministers have absolutely nothing to crow about.
A long way to go
Average real wages in March were up 0.4 per cent on the previous month, as pay packets grew faster than the cost of living.
But this hasn’t made much impact on all the ground lost since the financial crisis of 2008.
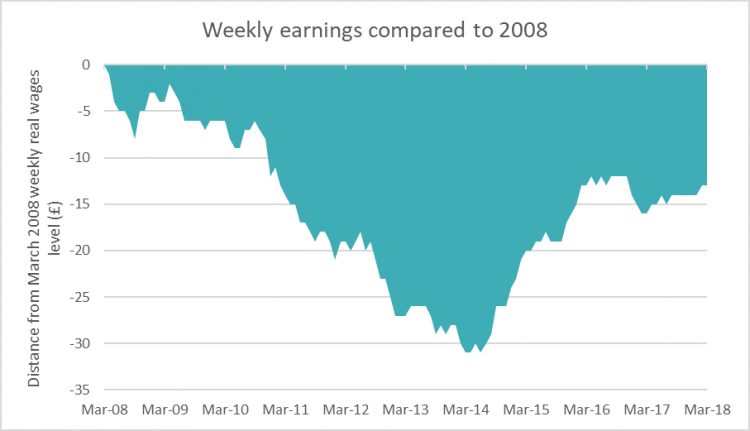
In fact, workers are still £13 a week worse off than 10 years ago, and they can’t expect to get back to 2008 levels for another seven years.
That means we’re still in the middle of the biggest pay squeeze in two centuries, as the following chart shows:
Wages are growing…for some
The headline figures also disguise the fact that workers in many industries still aren’t seeing their pay go up.
The chart below shows the growth in average nominal pay (before taking account of increases in the cost of living) excluding bonuses between the first quarter of 2017 and the first quarter of 2018:
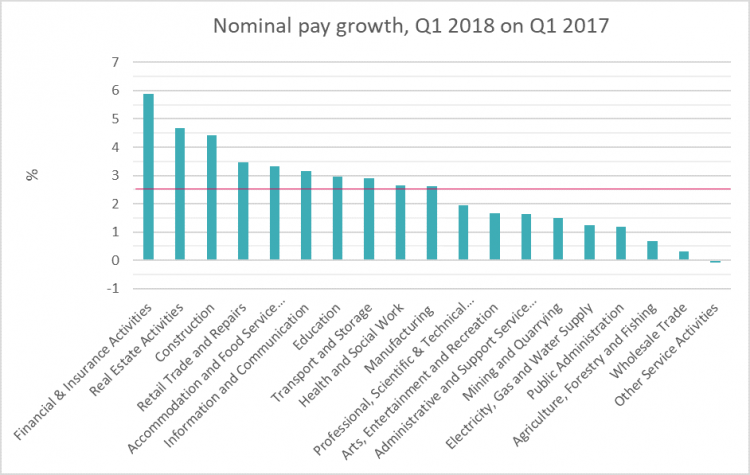
While the financial, real estate and construction industries saw healthy pay increases, healthcare and construction managed wage growth only just above the average CPIH inflation over the period (the purple line). That means average incomes in these industries only just kept up with price increases.
And in nine out of 19 industries – including professional services, business support and public administration – wages grew slower than inflation. So real pay is still falling in these sectors, which employ almost 40% of UK workers.
It’s important to stress that we’re being kind to the government here by using its preferred inflation index.
CPIH typically comes in lower than CPI (2.6 per on average cent over the quarter) or RPI (3.7 per cent). According to the latter, pay growth was well below inflation in 16 out of 19 industries.
Winners and losers?
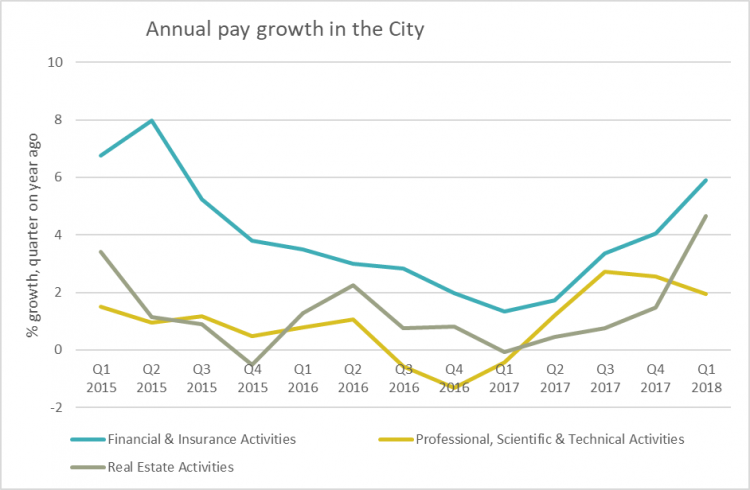
Looking at trends in specific sectors of the economy suggests that the outlook for pay is rosy in the City of London.
The following three charts all use the same scale. The first shows that, although average increases have been slowing over the last six months in professional services, pay rises have been accelerating in the finance and property industries since the beginning of 2017:
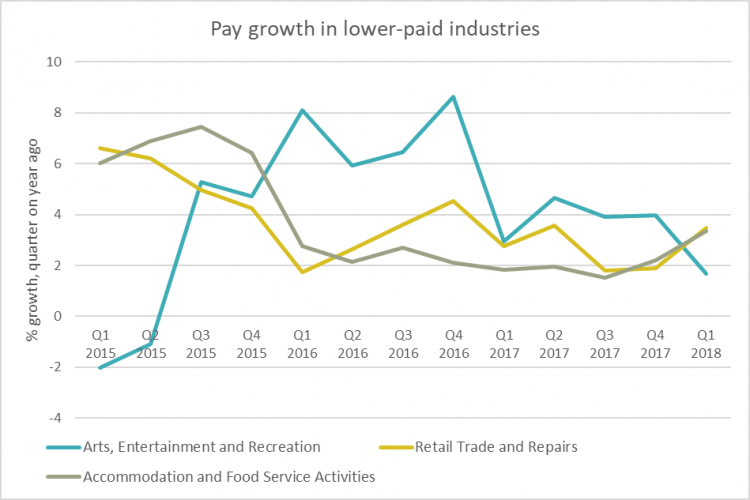
In lower-paid industries the trend is less clear. Hospitality and retail both saw wages pick up slightly in recent quarters and above inflation increases in Q1 2017. In the entertainment industry, however, wage growth has slowed markedly since the beginning of 2016:
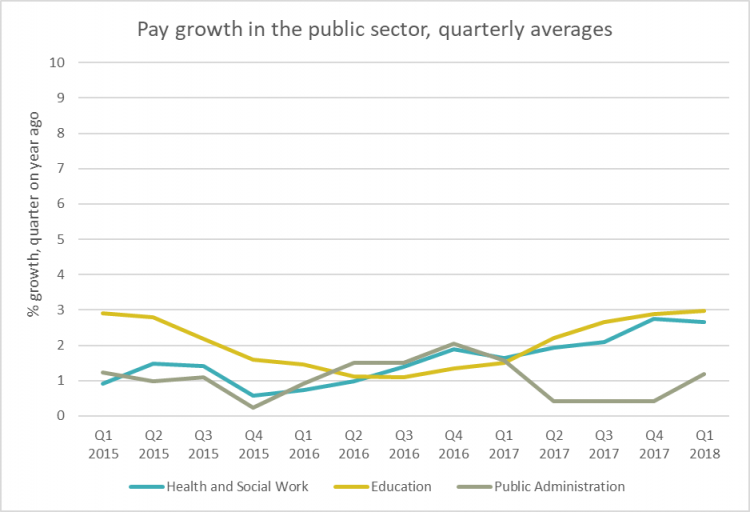
In the public sector there has been a steady (but gradual) upward trend in health and education from Q4 2015 and Q3 2016 respectively. But at this rate it will take a long time to reverse the eight years of pay caps and freezes that have left many public servants around £3,000 a year worse off.
The outlook is even grimmer for the rest of the public sector.
In the first quarter of the year, nominal wage growth averaged just 1.2 per cent. It has only nudged above 2 per cent – the Bank of England’s inflation target – once in the last two years:
No sign of acceleration
Looking at pay more generally, it’s difficult to find evidence of accelerating wage growth.
The chart below shows the maximum and minimum quarterly average pay growth by industry in grey and yellow:
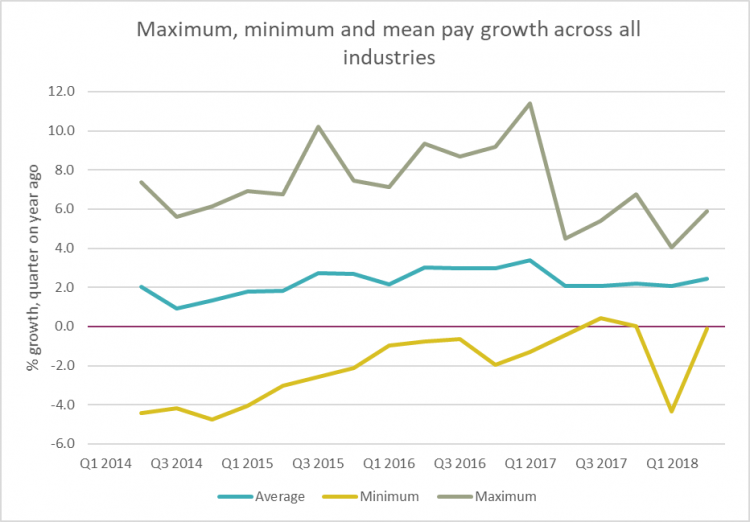
The turquoise line – the average across all industries – has barely budged from the 2 per cent mark over the last four quarters.
It also looks like industries have converged on this point to a degree, with both the number of outlying industries and the gap between the best and worst performing industries falling in recent quarters.
This is all evidence that, while two months of wage increases is good news, many workers aren’t sharing in this growth.
It's clear we still have a long, long way to go before wages return to 2008 levels, and there’s little sign that we’ll get there any time soon.
Stay Updated
Want to hear about our latest news and blogs?
Sign up now to get it straight to your inbox