
The Chancellor offered no light at the end of the tunnel for working people
Today we are asked to celebrate almost non-existent improvements in the public budget, and yet more inaction in the face of years of severe hardship and a still dismal outlook for working people. Here are five ways government policies are failing working people.
1. Economic growth very weak
The Office for Budget Responsibility (OBR) revised up its forecast for economic growth in 2018 to 1.5% from 1.4%. This will be
- the lowest growth for six years (it was 1.5% in 2012)
- the joint weakest of the G7 economies
- over the next five years growth is expected to average only 1.4% a year – unprecedentedly weak for a ‘recovery’
GDP growth in 2018, per cent
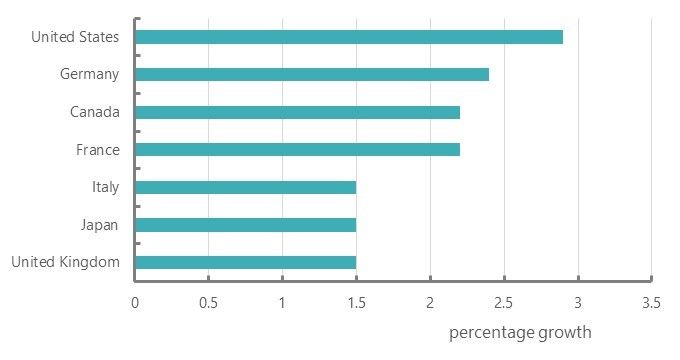
Source: OECD and OBR
2. No news on the real wage crisis
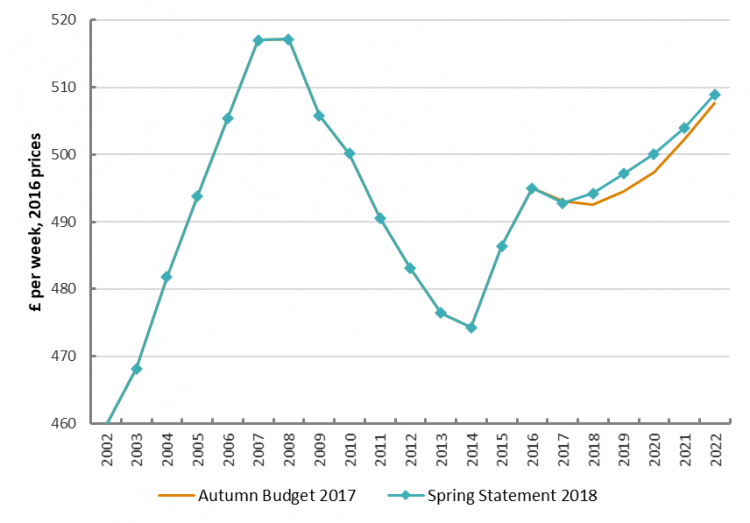
The OBR offered a most marginal gain of 0.3 % in real wages in 2018, after real wages shrank in seven of the previous nine years since the global financial crisis. The position has barely changed from the shocking downgrade at the autumn forecast: real wages in 2018 will still be down by 4.5% – or £20 a week on average – on the pre-crisis level ten years ago. The OBR still does not expect real wages to have recovered this level even in 2022-23. (And I am using CPI, which is generous.)
Real wages, 2016 prices
3. Eight years of public services cuts; (at least) five more to come
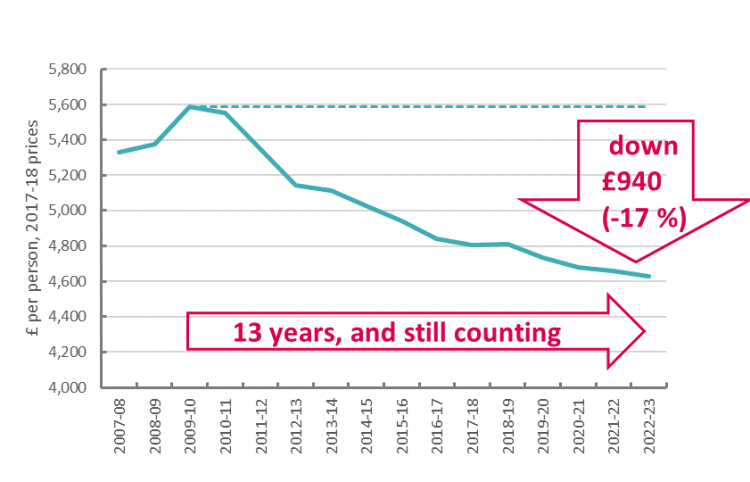
The OBR figures also confirm that public service cuts will continue through to 2022-23. This will amount to a reduction of close to a fifth in per person spending. And this doesn’t include benefit cuts.
Public services spending, real terms per head of population
4. Infrastructure spending is still falling vastly short
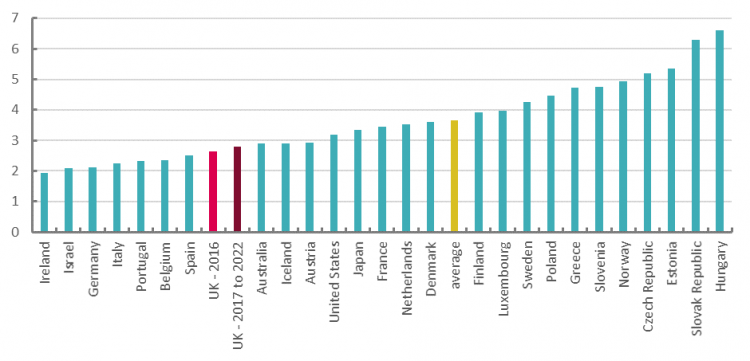
In the meantime the repeated emphasis given to new public infrastructure spending falls vastly short of what is needed. In 2016 UK public infrastructure expenditure was 2.6% of GDP against the OECD average of 3.7%. With the new plans in place, the average over 2017 to 2022 will still only be 2.8% - which still leaves us 20th out of 27 OECD countries
Public investment, % GDP in 2016
5. Public debt unresolved
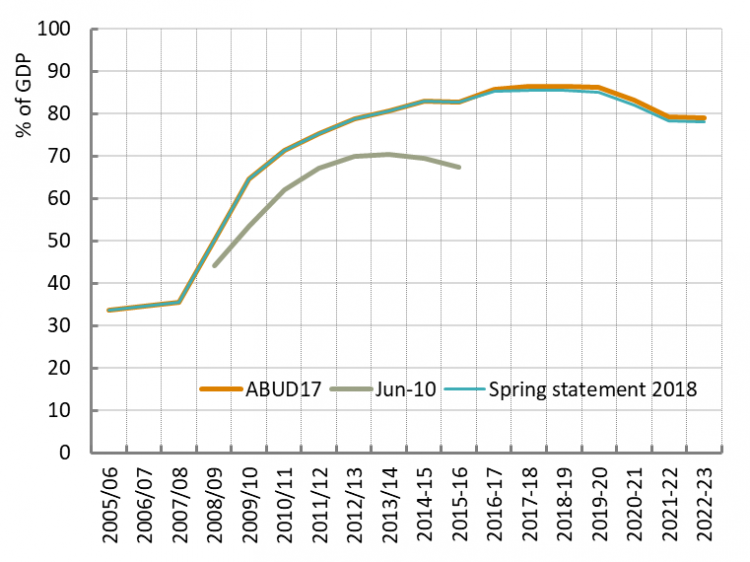
And, finally, the much-hyped improvement in public borrowing scarcely happened. The budget deficit for 2017-19 came in at £45 billion, around £5bn better than expected, but this hasn’t translated into an improvement in performance against the ‘fiscal target’ for the deficit. But the bottom line is the public debt. Here gains are miniscule, and trivial in the great scheme of the failure against the original plan in June 2010. Instead of peaking at 70.3 % of GDP four years ago, it is now forecast to peak at 85.6% this year.
Public sector net debt, % GDP
As is usual on these occasions the Chancellor put a brave face on grim prospects for the economy and for working people. His account is far removed from the lived experience of working people, the hardships endured, and the fears for the future – of the young in particular.
The government is unwilling to confront the fact that these hardships and fears have been caused – or at the very least greatly exacerbated – by its own refusal to abandon austerity policies that have failed. Cuts since 2010 have damaged economic growth and have proven counterproductive to improvements in the public sector finances. The reverse course of action is urgently needed.
Image credit: Jack Taylor/Getty Images
Stay Updated
Want to hear about our latest news and blogs?
Sign up now to get it straight to your inbox