Jobs monitor - the impact of the pandemic on BME employment
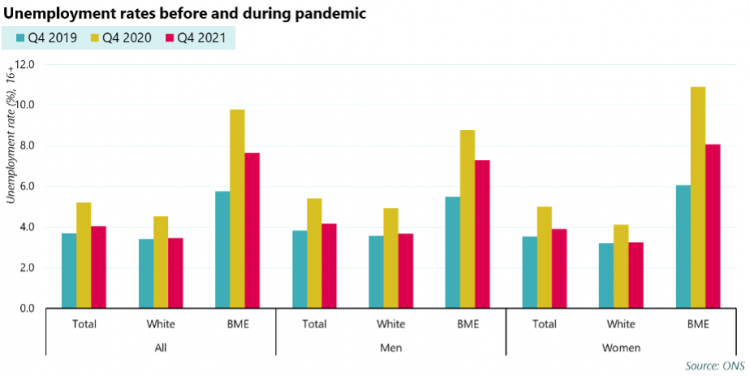
The rise in overall unemployment during the pandemic was more subdued than first expected. When the pandemic hit, there were fears that the unemployment rate could hit double figures. In reality, it peaked at 5.3 per cent in Q4 2020 – up from around 4 per cent before the pandemic hit.
This was largely down to the furlough scheme – one of the few successes of the government’s response to the pandemic. Proposed by the trade the union movement, and implemented with its involvement, it saved millions of jobs and helped to avoid the rise in unemployment first feared.
The headline unemployment rate has now returned to pre-pandemic levels. But this headline figure masks an unequal labour market recovery.
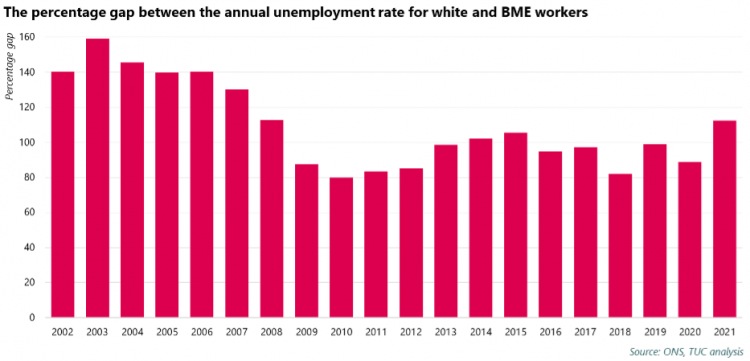
While the headline unemployment rate among all workers has returned to pre-pandemic levels, this isn’t true for Black and minority ethnic (BME) workers. BME workers faced a higher unemployment rate before the pandemic, were hit harder during the pandemic itself, and are now seeing a slower recovery than white workers. The pandemic has widened the gap in unemployment rates between white and BME workers to the widest it’s been since 2008.
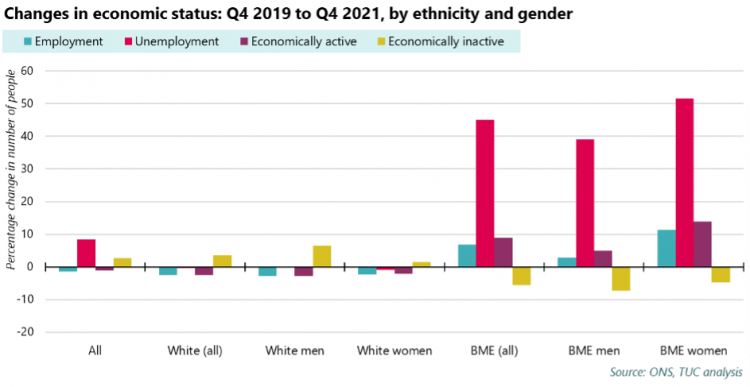
While unemployment has risen among BME workers, so has employment. This seemingly contradictory rise in both employment and unemployment can be explained by a rise in the number of BME people who are ‘economically active’ (either employed or actively seeking work).
Unemployment
Even before the pandemic hit, the unemployment rate among BME workers was higher than it was among white workers (5.8 per cent in Q4 2019, compared to 3.4 per cent for white workers). 1
For both white and BME workers, the unemployment rate during the pandemic peaked in Q4 2020. The unemployment rate for white workers rose to 4.5 per cent. The unemployment rate among BME workers rose faster and higher, hitting 9.8 per cent in the same quarter. This particularly hit BME women, who faced an unemployment rate of 10.9 per cent.
Between Q4 2020 and Q4 2021, the unemployment rate fell (down to 3.5 per cent for white workers, and 7.7 per cent for BME workers). The unemployment rate for BME workers is now 1.9 percentage points (33 per cent) higher than it was pre-pandemic. For white workers, it's 0.1 percentage points (2 per cent) higher.
Unemployment by age
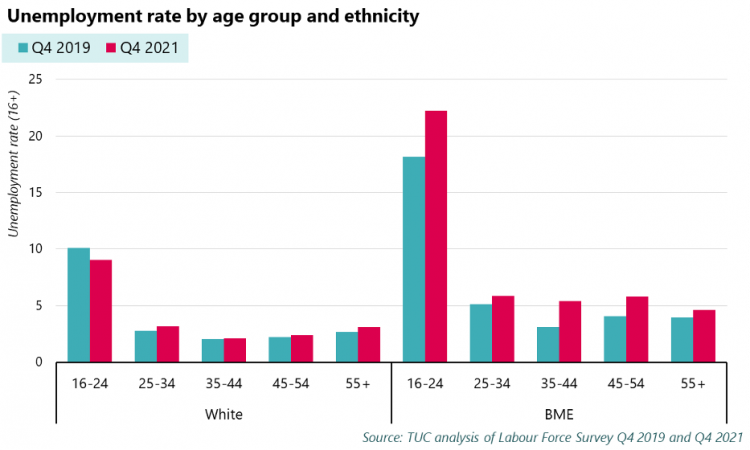
Between Q4 2019 and Q4 2021, the unemployment rate for BME workers grew across all age groups.2
- Among young workers (16-24), the BME unemployment rate grew from 18.2 per cent in Q4 2019 to 22.3 per cent in Q4 2021. For the same age group of white workers, the unemployment rate fell
- The rise in the unemployment rate was steepest among BME people aged 35-44, where the rate grew by 73 percent – from 3.1 per cent in Q4 2019 to 5.4 per cent in Q4 2021. Across the same period, the unemployment rate for white workers of the same age remained flat
- The unemployment rate for BME workers aged 45-54 increased from 4.0 per cent to 5.8 per cent. For white workers of the same age, it rose by just 0.2 percentage points
- 1Except where noted, analysis is based on the ONS dataset A09: Labour market status by ethnic group. Available at: https://www.ons.gov.uk/employmentandlabourmarket/peopleinwork/employmentandemployeetypes/datasets/labourmarketstatusbyethnicgroupa09. As the data is not seasonally adjusted, comparisons are only made between the same quarters in different years (e.g. Q4 2019 and Q4 2021), or an annual average is used.
- 2Unemployment by age group is based on TUC analysis of Labour Force Survey Q4 2019 and Q4 2021.
The widening unemployment gap
The disproportionate impact of the pandemic on BME unemployment has led to a widening of the ‘unemployment gap’ between BME and white workers.
The 'unemployment gap' shows how many per cent higher the unemployment rate for BME workers is compared to the unemployment rate for white workers. A 100 per cent gap, for example, means that the BME unemployment rate is twice as high. Expressing the gap as a percentage allows for comparisons over time.
In Q4 2019, the gap was 69 per cent. By Q4 2021, it had widened to 120 per cent. If we look at annual averages, the gap in 2021 was 112 per cent, the widest it’s been since 2008.
Employment
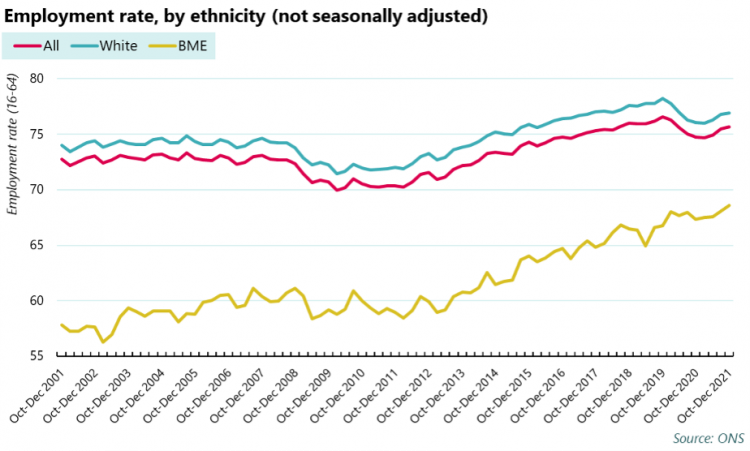
While the unemployment rate among BME workers has increased across the pandemic, so has the employment rate.
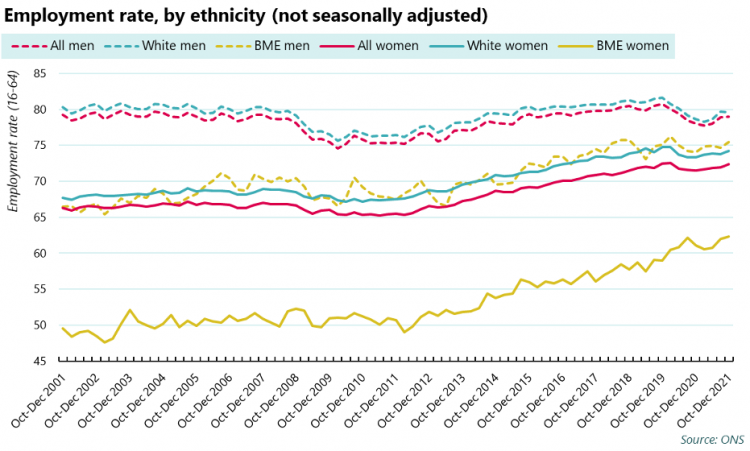
The employment rate for BME workers is the highest since current records began in 2001, but remains 9.7 percentage points below the employment rate for white workers. The number of BME people in employment is also at a record high (4.26 million).
The rise in BME employment across the pandemic is being driven by women. Between Q4 2019 and Q4 2019, the number of BME workers in employment rose by 270,719 people. Of these, three-quarters (76 per cent, or 206,906) were women. The employment rate for BME women is now at a record high. As the chart below makes clear, however, the trend of rising employment among BME women isn’t limited to past two years.
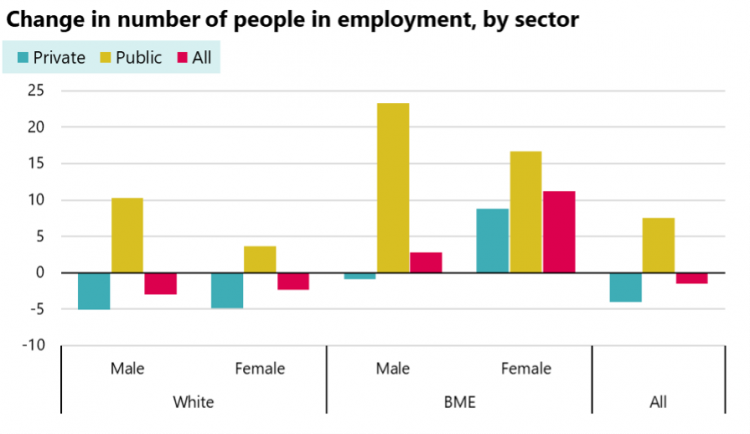
The rise in BME employment has been particularly strong in the public sector.3 The number of BME public sector workers grew by 19 per cent (169,000) between Q4 2019 and Q4 2021. Across this same period, growth in the number of BME male workers was completely driven by the public sector.
- 3 Analysis of changes in employment by sector and industry are based on TUC analysis of the Labour Force Survey Q4 2019 and Q4 2021.
When we look at an industry breakdown, the industries that have seen the highest growth in the number of BME workers are education (+98,500), information and communication (+65,000), public admin and defence (+54,400), professional industries (+53,900) and health and social work (+46,900).
There’s been a substantial fall in the number of BME workers in wholesale and retail. This is part of an overall fall in the number of workers in this industry, but has disproportionately hit BME workers. The number of BME workers has fallen by 12 per cent, compared to a 7 per cent fall in the number of white workers.
A full industry breakdown is available in the annex.
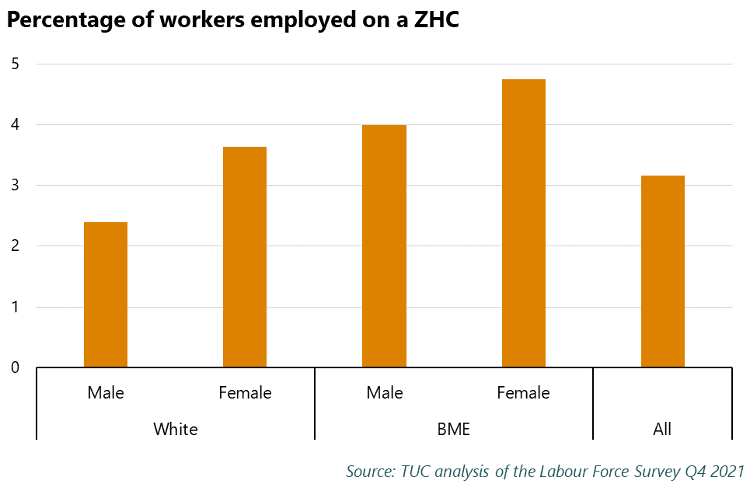
It’s worth noting here that the labour market for BME workers is often more insecure. BME workers, especially BME women, are more likely to be employed on zero-hours contracts.
BME employees are also more likely than white employees to be employed on temporary contracts. 10.3 per cent of BME employees were in temporary employment in Q4 2021, compared to 5.5 per cent of white employees. This has grown over the past two years, from 7.9 per cent of BME employees and 4.8 per cent of white employees in Q4 2019.4
How can both employment and unemployment be high?
It may seem contradictory for both the BME unemployment rate and employment rate to be higher now than they were before the pandemic.
But the reason for this is a change in the number of BME workers in the labour market. Across the same period, the BME activity rate has increased and economic inactivity has dropped. The activity rate measures economic activity – the number of people who are employed or unemployed. This is in accordance with the ILO definition of unemployment as someone who is:
- without a job, have been actively seeking work in the past four weeks and are available to start work in the next two weeks
- out of work, have found a job and are waiting to start it in the next two weeks
Economic inactivity is the number of people who are not in employment, have not been seeking work within the last 4 weeks, and/or are unable to start work within the next 2 weeks.
Between Q4 2019 and Q4 2021, the number of BME people who are economically active rose by 9 per cent (380,546). Around thirty per cent of this increase was a rise in unemployment (109,827 people), and the rest was a rise in employment (270,719). This meant the number of BME people in unemployment rose by 45 per cent across the period.
- 4Data for both zero-hours contracts and temporary employment is based on TUC analysis of the Labour Force Survey.
This shows that more BME people have entered the labour market but not all have been able to find jobs.
In the same way that each age group of BME workers saw rising unemployment, each age group (except those aged 55+) saw a decline in the number of people inactive.
Change in number of people inactive and the unemployment rate between Q4 2019 and Q4 2021
|
|
|
Change in number of people inactive |
% change in number of people inactive |
% change in unemployment rate |
|
White |
16-24 |
86201 |
5 |
-11 |
|
25-34 |
32406 |
4 |
14 |
|
|
35-44 |
-1102 |
0 |
2 |
|
|
45-54 |
39884 |
4 |
8 |
|
|
55+ |
454457 |
4 |
16 |
|
|
BME |
16-24 |
-62671 |
-9 |
22 |
|
25-34 |
-21527 |
-7 |
14 |
|
|
35-44 |
-42052 |
-13 |
73 |
|
|
45-54 |
-20339 |
-10 |
44 |
|
|
55+ |
24578 |
4 |
17 |
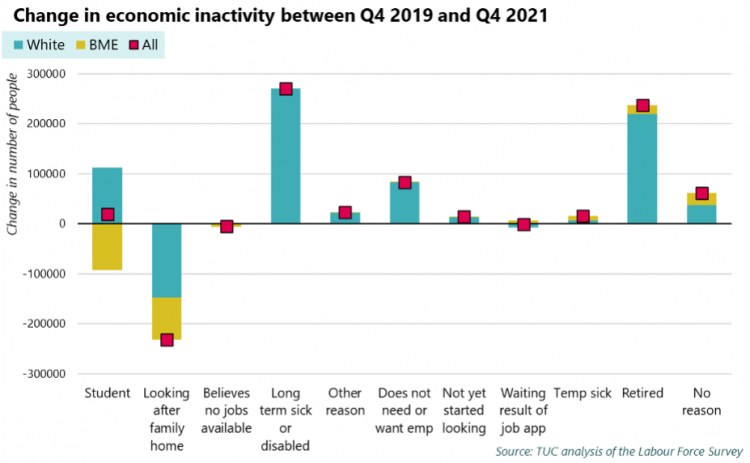
What’s behind the drop in inactivity?
There seems to be two main drivers of the drop in inactivity.5
- Students. There’s been a significant drop in the number of BME students who are economically inactive (-13.6 per cent, 92,484 people). This, to be clear, isn’t necessarily a drop in the number of students. It’s a drop in the number of BME students who are unable to work, choosing not to work or not currently looking for work.
- Looking after family/home. The drop in number of people economically inactive due to looking after family or home has been one of the trends of the pandemic. It’s disproportionately impacting BME workers, with a 15.3 per cent drop compared to 10.5 per cent among white workers.
- 5Analysis of inactivity by ethnicity is based on TUC analysis of the Labour Force Survey Q4 2019 and Q4 2021
This points towards the experience of BME workers across the pandemic being a time when more BME workers have entered the labour market, but not all have found jobs. This has led to both increased employment (especially in the public sector), but also a rise in the unemployment rate. The rise in the unemployment rate has particularly impacted BME workers aged 35-54, and young workers.
Two big causes of the increase in BME activity in the labour market are a drop in the number of BME people who are not working and not currently looking for work due to being students or due to looking after family.
The data can’t tell us why this is happening, but there are a number of reasons BME workers may be entering the labour market. The cost of living could potentially be a factor. We know that BME workers were more likely to be cutting back spending during the pandemic6 , and that wealth inequality means BME people are less likely to have savings to fall back on.7 The drop in the number of BME people who are deciding not to work due to being students or looking after family could therefore be because they can no longer afford to do so.
The fall in inactivity could also be due to changes in the labour market. The pandemic has led to an increase in working from home, which may have attracted people who were previously unable to balance work alongside studies or looking after family to the labour market.
The data shows us that BME workers, who were disproportionately impacted through the pandemic by Covid-related job losses, are now significantly more likely to be trapped in unemployment than their white counterparts. We need action to end to the structural discrimination and inequalities that hold BME people back at work.
What we want to see change
The TUC is calling on employers to:
• Work with trade unions to establish a comprehensive ethnic monitoring system covering ethnicity pay-gap reporting, recruitment, retention, promotion, pay and grading, access to training, performance management and discipline and grievance procedures.
• Analyse, evaluate and publish their monitoring data
• Work with trade unions and workforce representatives to develop action plans that address racial disparities in their workplaces.
The government and public authorities to:
• Introduce race equality requirements into public sector contracts for the supply of goods and services to incentivise companies to improve their race equality policies and practices and minimise the use of zero-hours, temporary and agency contracts and promote permanent employment. Companies that do not meet the requirements should not be awarded a public contract.
Calls on the EHRC to:
• Work with trade unions to strategically use their investigative powers and the newly established Race equality Fund to address race discrimination in all labour market sectors.
Annex
Change in number of workers by industry
|
Industry section in main job (1 character) |
White |
BME |
Total |
|
All |
-727832 |
258995 |
-468837 |
|
P Education |
-57449 |
98528 |
41079 |
|
J Information and communication |
56422 |
65052 |
121474 |
|
O Public admin and defence |
275596 |
54421 |
330017 |
|
M Prof, scientific, technical activ. |
100328 |
53882 |
154210 |
|
Q Health and social work |
-89396 |
46935 |
-42461 |
|
F Construction |
-168316 |
17757 |
-150559 |
|
D Electricity, gas, air cond supply |
-19135 |
10351 |
-8784 |
|
H Transport and storage |
-20442 |
5738 |
-14704 |
|
E Water supply, sewerage, waste |
39104 |
3784 |
42888 |
|
R Arts, entertainment and recreation |
-34017 |
2287 |
-31730 |
|
K Financial and insurance activities |
92484 |
704 |
93188 |
|
U Extraterritorial organisations |
16634 |
-1292 |
15342 |
|
I Accommodation and food services |
-135584 |
-1381 |
-136965 |
|
T Households as employers |
-7986 |
-2698 |
-10684 |
|
S Other service activities |
-76954 |
-4919 |
-81873 |
|
N Admin and support services |
-93957 |
-5011 |
-98968 |
|
C Manufacturing |
-296771 |
-7811 |
-304582 |
|
L Real estate activities |
12434 |
-8964 |
3470 |
|
G Wholesale, retail, repair of vehicles |
-247146 |
-65244 |
-312390 |
Change in reasons for inactivity between Q4 2019 and Q4 2021
|
|
Change |
Percentage change |
||||
|
|
White |
BME |
Total |
White |
BME |
Total |
|
Student |
112654 |
-92484 |
20170 |
7.3 |
-13.6 |
0.9 |
|
Looking after family home |
-147889 |
-83740 |
-231629 |
-10.5 |
-15.3 |
-11.8 |
|
Believes no jobs available |
826 |
-5914 |
-5088 |
3.1 |
-69.0 |
-14.6 |
|
Long term sick or disabled |
271028 |
-411 |
270617 |
13.3 |
-0.2 |
11.8 |
|
Other reason |
22439 |
588 |
23027 |
7.0 |
0.5 |
5.4 |
|
Does not need or want emp |
82709 |
1140 |
83849 |
30.5 |
4.2 |
28.1 |
|
Not yet started looking |
13138 |
1323 |
14461 |
13.2 |
4.6 |
11.2 |
|
Waiting result of job app |
-7324 |
6491 |
-833 |
-27.9 |
119.8 |
-2.6 |
|
Temp sick |
6700 |
9562 |
16262 |
4.4 |
46.9 |
9.4 |
|
Retired |
220084 |
17563 |
237647 |
2.0 |
3.7 |
2.1 |
|
No reason |
37481 |
23871 |
61352 |
31.4 |
78.0 |
40.9 |
- 6The impact of the pandemic on household finances, TUC (2021). Available at: https://www.tuc.org.uk/research-analysis/reports/impact-pandemic-househ…
- 7The Colour of Money, Runnymede Trust (2020). Available at: https://www.runnymedetrust.org/publications/the-colour-of-money
Stay Updated
Want to hear about our latest news and blogs?
Sign up now to get it straight to your inbox

