Disability pay and employment gaps 2020
Introduction
This short note looks at the disability pay gap, which is the difference between the median hourly pay of disabled and non-disabled people, and the disability employment gap, which is the difference between the employment rates of disabled and non-disabled people.
It builds on TUC research published 2018 and in 2019.
The note shows that disabled people continue to face double discrimination. Not only are they less likely to have a paid job but when they do, disabled people earn substantially less than their non-disabled peers.
Disability employment gap narrows
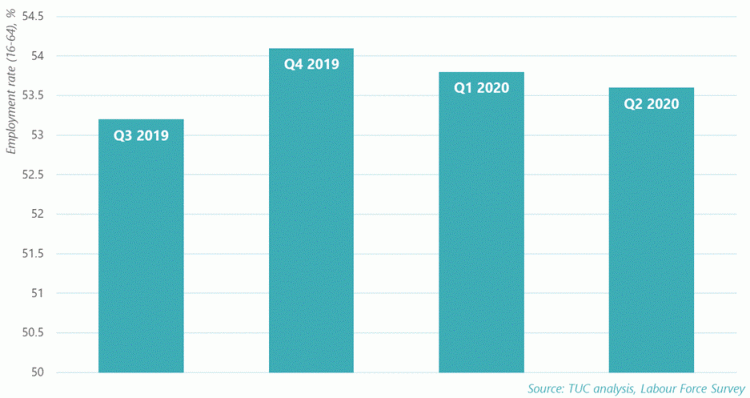
The disability employment gap has slightly decreased in 2020. In 2019, the employment rate for disabled people was 51.8 per cent, compared to 81.6 per cent for non-disabled people. This an employment gap of 29.8 percentage points (ppt).
In 2020, the employment rate for disabled people is 53.7 per cent, compared to 82.0 per cent for non-disabled people. This an employment gap of 28.4 ppt.
This represents a 1.4 ppt reduction in the gap and, while this is an improvement, the gap remains much too large.
It should however be highlighted that the last two quarters of our analysis highlighted a small but notable expansion of the gap indicating it had stopped decreasing and started to increase once again.
The disability employment gap by gender
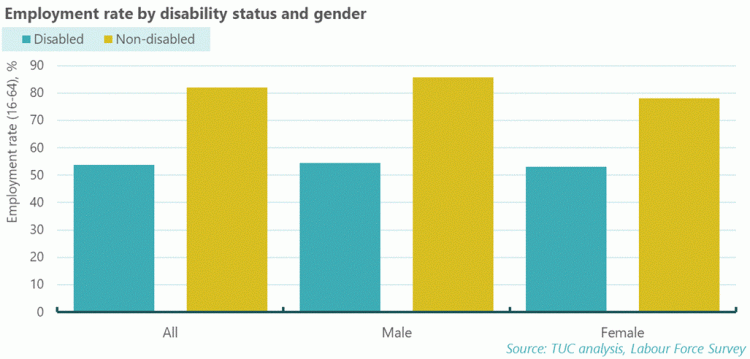
Our analysis shows little difference in employment rates between disabled women and men. It found that the employment rate for disabled women is 53.2 per cent, compared to 54.4 per cent for disabled men.
The employment rate for non-disabled men is 85.7 per cent and of non-disabled women is 75 per cent
Our analysis has highlighted the gap between disabled women and non-disabled men is 32.6 ppt.
The disability employment gap by race
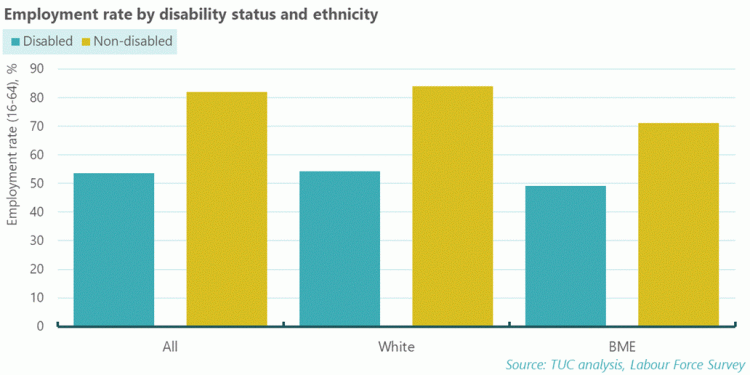
Our analysis shows 5.1ppt difference in employment rates between disabled BME people and disabled white people. It found disabled BME workers had an employment rate of 49.2 per cent while white disabled workers had an employment rate of 54.3 per cent.
The employment rate of non-disabled BME people is 71.1 per cent and of white non-disabled people, it is 83.9 per cent.
Our analysis has highlighted the gap between disabled BME workers and non-disabled white people is 34.7 ppt, which is higher than the overall disability employment gap (28.4 ppt).
Disability pay gap widens
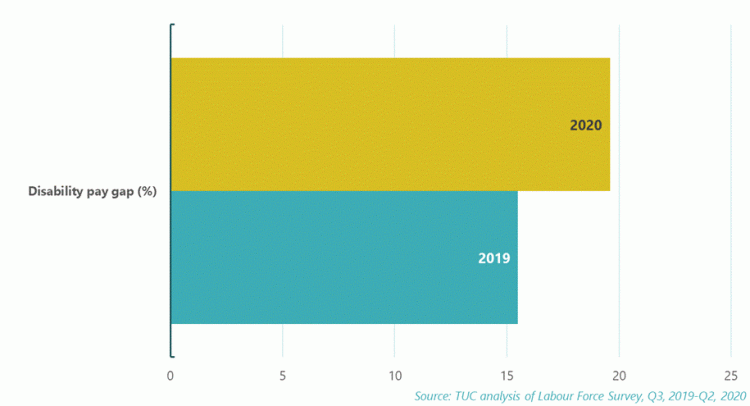
While the disability employment gap has slightly narrowed the disability pay gap has increased drastically compared to last year. In 2019, non-disabled workers earnt £1.65 (15.5 per cent) more per hour than disabled workers. In 2020, this has increased to £2.10 (19.6 per cent).
This means that a disabled worker working 35 hours per week would, on average, earn £3,822 per year less than a non-disabled worker. In 2019 this calculation found disabled worker would, on average, earn £3,000 per year less than a non-disabled worker.
The disability pay gap by gender
A comparison of the median hourly earnings of disabled men and women and nondisabled men and women shows all three other groups are substantially worse off compared to non-disabled men. However, disabled women face the largest pay gap. The pay gap for disabled women is nearly nine percentage points higher than the pay gap for women overall. Both groups of women are paid less than disabled and non-disabled men, with non-disabled men being paid 36 per cent more than disabled women.
|
Median hourly pay (£) |
Pay gap (£) |
Pay gap (%) |
|
|
Men without disabilities |
13.88 |
- |
- |
|
Disabled men |
11.80 |
2.08 |
17.6 |
|
Women without disabilities |
11.73 |
2.15 |
18.3 |
|
Disabled women |
10.20 |
3.68 |
36.0 |
Regional variations
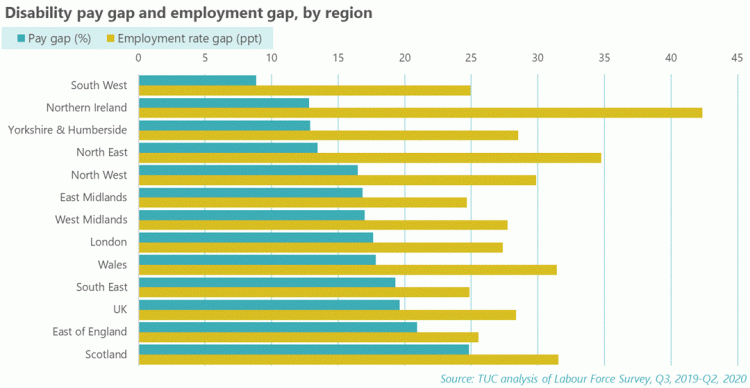
Both the disability pay gap and the disability employment gap vary by region. East of England (20.9 per cent) and Scotland (24.8 per cent) both have disability pay gaps higher than for the UK overall.
Northern Ireland has the highest disability employment gap (42.4 ppt), with the North East (34.8 ppt), Scotland (31.6 ppt) and Wales (31.4) all having gaps above 30 percentage points.
Causes of the pay gap
A breakdown of the causes of the disability pay gap can be found in the TUC’s 2019 report on the topic.
The main factors driving the pay and employment gap for disabled people are:
-
Part-time working: A higher proportion of disabled people than non-disabled people work part-time. Part-time jobs, especially in the private sector, are paid less per hour than fulltime jobs.
-
Low-paid work: Disabled people are over-represented in lower paid jobs like caring, leisure and other services and sales and customer services, and under-represented in senior and managerial roles.
-
Education: Some disabled people leave education earlier than non-disabled people. However, even where disabled and non-disabled people have the same qualifications there is still a big pay gap.
The pay gap is also linked to unlawful discrimination, structural barriers and negative attitudes, says the TUC.
Zero-hours contracts
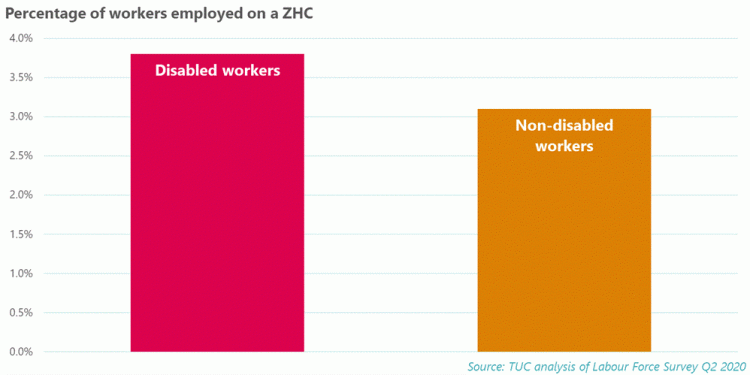
Additionally this year our analysis also found that disabled workers are more likely to be employed on zero-hours contracts (ZHCs). While 3.1 per cent of non-disabled workers are employed on a ZHC, this rises to 3.8 per cent of disabled workers.
Recommendations for change
To address the disability pay gap, the TUC wants the government to bring in mandatory disability pay gap reporting for all employers with more than 50 employees.
The legislation should be accompanied by a duty on employers to produce targeted action plans identifying the steps they will take to address any gaps identified, including ensuring disabled workers with invisible impairments feel confident in completing workplace equality monitoring.
A full set of TUC recommendations to address the pay and employment gap can be found in its 2019 report.
Stay Updated
Want to hear about our latest news and blogs?
Sign up now to get it straight to your inbox

