The scale of insecure work in the UK
How many people are in insecure employment?
TUC analysis of labour market data shows that 4 million people in 2024 were in insecure work. This amounts to around one in eight of the workforce.
In 2011, 3.2 million people were in insecure work. By 2024, this was 4 million. This means that over 14 years of conservative lead governments the net increase in insecure employment was around 800,000.
Between 2011 and 2024, the proportion of those in insecure work also grew, from 10.7 percent of the workforce to 11.7 percent.
How does insecure employment affect working people?
Insecure work has an enormous effect on people at work. The prospect of having work offered or cancelled at short notice makes it hard to budget household bills, plan wider life and meet caring responsibilities.
Insecure work is also low paid in comparison to permanent employment leaving many insecure workers struggling financially. Insecurity and low pay go hand-in-hand.
Who is affected by insecure employment?
When estimating the number of people in insecure work the TUC includes:
those on zero-hours contracts
agency, casual and seasonal workers (but not those on fixed–term contracts)
low paid self-employed workers (defined as those who earn less than two thirds of the median wage, which equates to £11.24 per hour). This group miss out on key rights and protections that come with being an employee and cannot afford to provide a safety net for when they are unable to work.

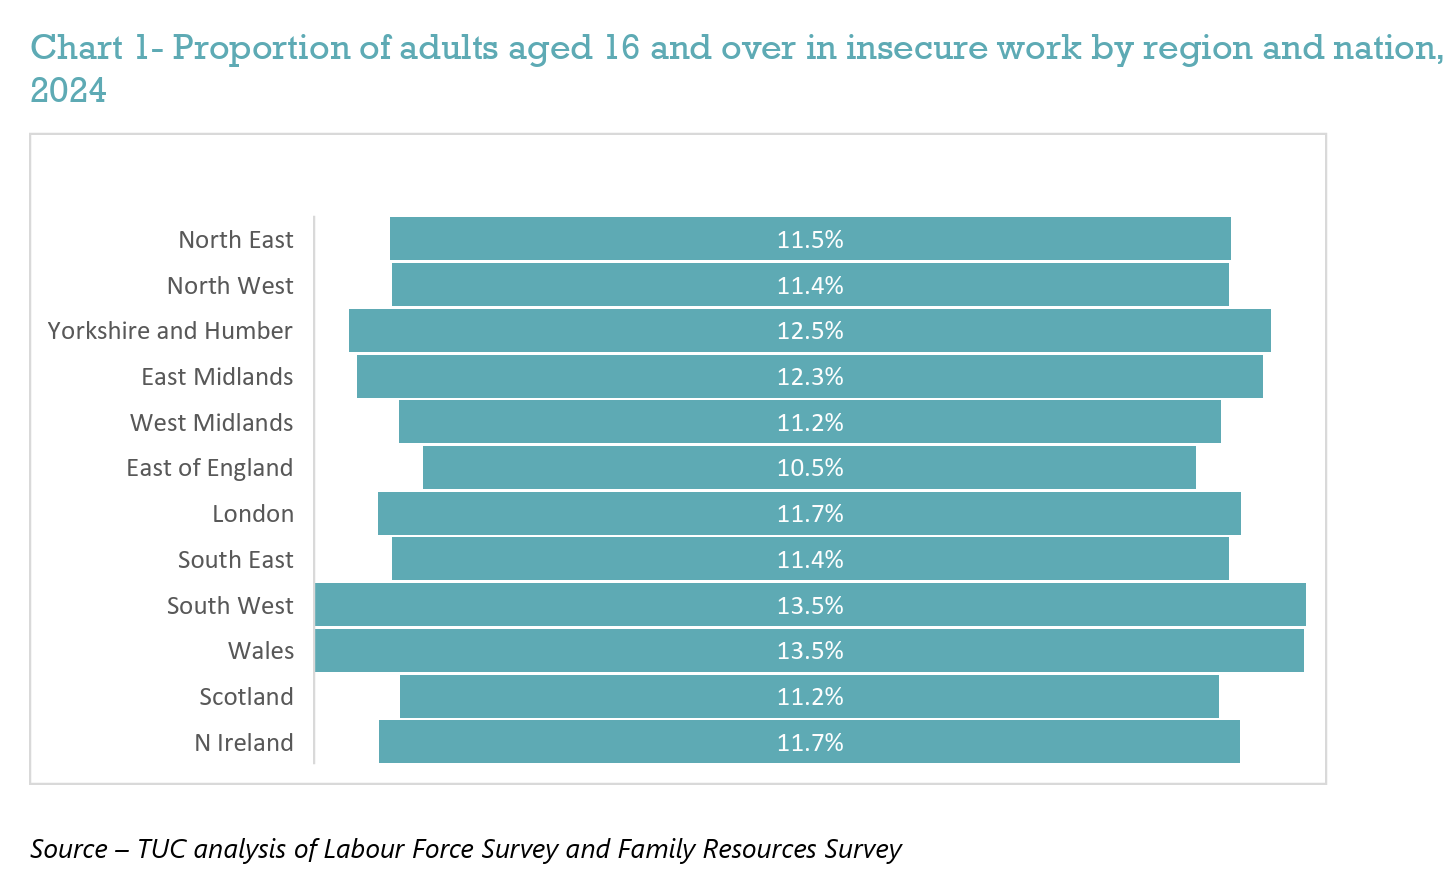
Insecure work is prevalent in all regions and nations in the United Kingdom. The South West and Wales have the highest proportion of people in work in insecure jobs, at 13.5 percent.
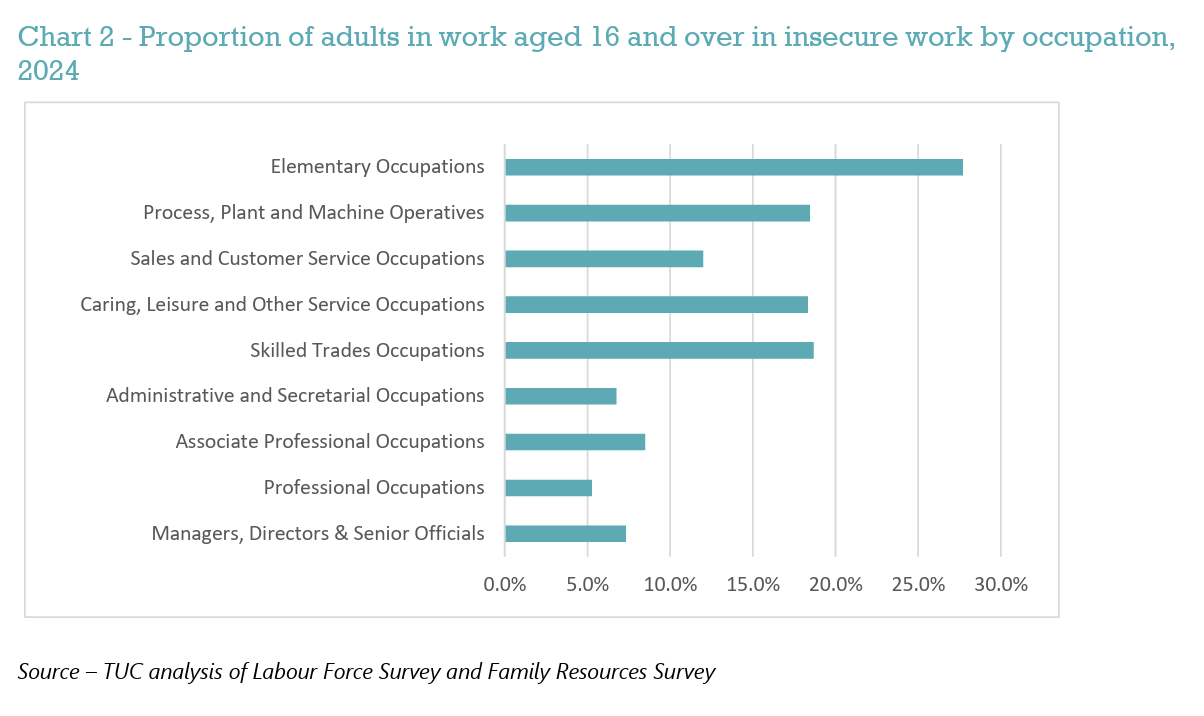
Insecure work is skewed to lower paying industries – elementary occupations; process, plant and machinery operatives; caring and leisure; and certain skills trades occupation.
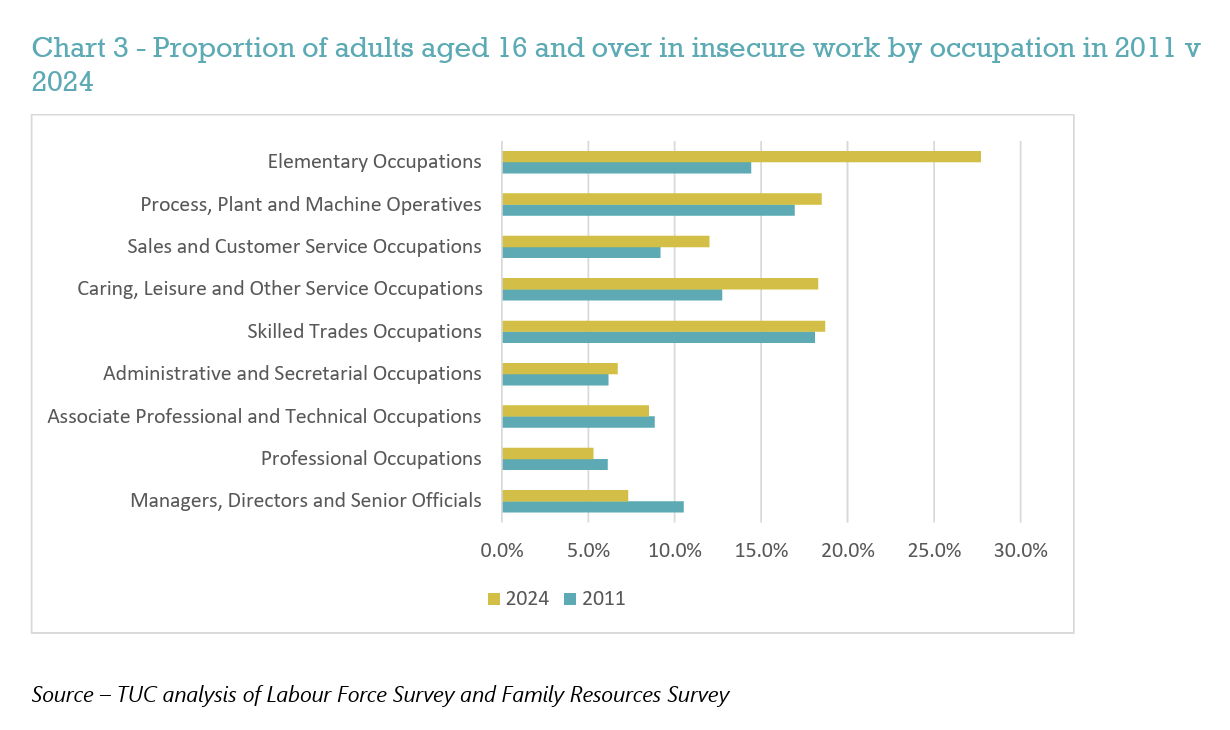
In addition, growth in insecure work since 2011 has been fuelled mainly by lower-paid sectors of the economy.
In care, leisure, service and elementary occupations the number of people in precarious employment has increased by 600,000 (+70 percent) between 2011 and 2014. 1 They also account for three quarters of the net increase in insecure work. The care sector in particular is made up overwhelmingly of women. Pay data shows the median wage gross hourly wage for elementary occupations is £12.07, and for caring, leisure and other services occupation is £13.02, in comparison for all employees the median is £17.03 in 2024.2 2 While roughly equal proportions of women and men work in elementary occupations (9.2% and 9.8% respectively) caring, leisure and other services occupations account for 14.2% of women’s employment, compared to 3.6% of men’s. 78.5% of people employed in this latter group of occupations are women
- 1 Looking at insecure work and occupation over time, it is difficult to make a direct comparison as the coding for the occupations between the two periods have changed. Though the coding change was mainly in managerial, senior officials, professional occupations, and associate professional occupations. See - https://www.ons.gov.uk/methodology/classificationsandstandards/standard… tureanddescriptionsofunitgroups#summary-of-the-changes-to-the-classification-structure-introduced-in-soc-2020
- 2 ONS Annual Survey of Hours and Earnings (ASHE)- Employee earnings in the UK - https://www.ons.gov.uk/employmentandlabourmarket/peopleinwork/earningsa… s/2024
Overall men are more likely to be insecure work; 12.4 percent of men are in insecure work compared to 11.1 percent of women.
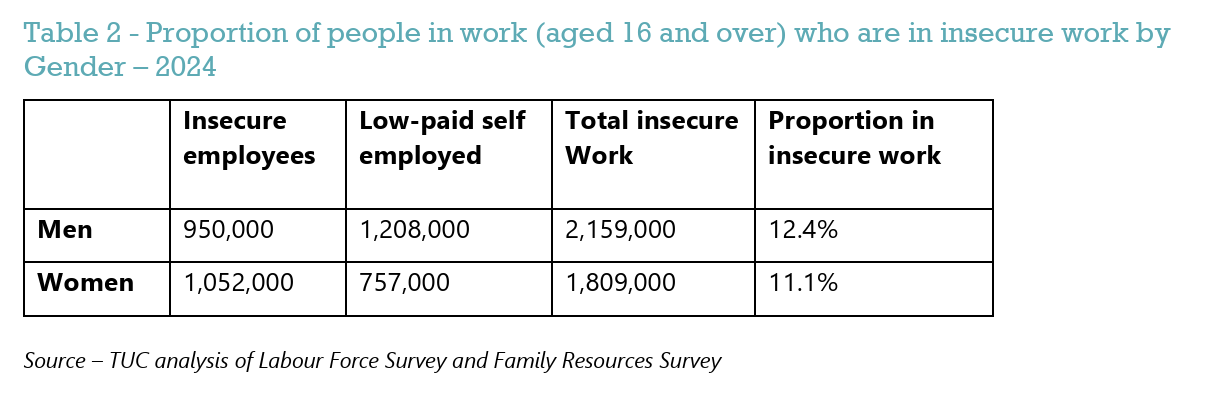
The overall figure however masks some key differences between men and women. Women are more likely to be insecure employees (zero hours, agency and casual forms of work) than men. As a proportion of employees 7.1 percent of women are insecure employees, in contrast to 6.5 percent of men who are insecure employees. However, the overall proportion of men in insecure work is higher due to the higher numbers of men in low-paid self-employment.
Insecure work disproportionately affects groups of workers who are already discriminated against in the workplace. TUC research shows that in 2024 16.3 percent of Black and Minority Ethnic (BME) workers are likely to be in insecure work. This compares to 10.8 per cent of white workers. In 2011 the proportion of BME workers in insecure work was 12.2 percent, compared to 10.5 per cent for white workers. In raw numbers, the number of BME workers in insecure work increased by over 2 and half times from 360,000 to 935,000.
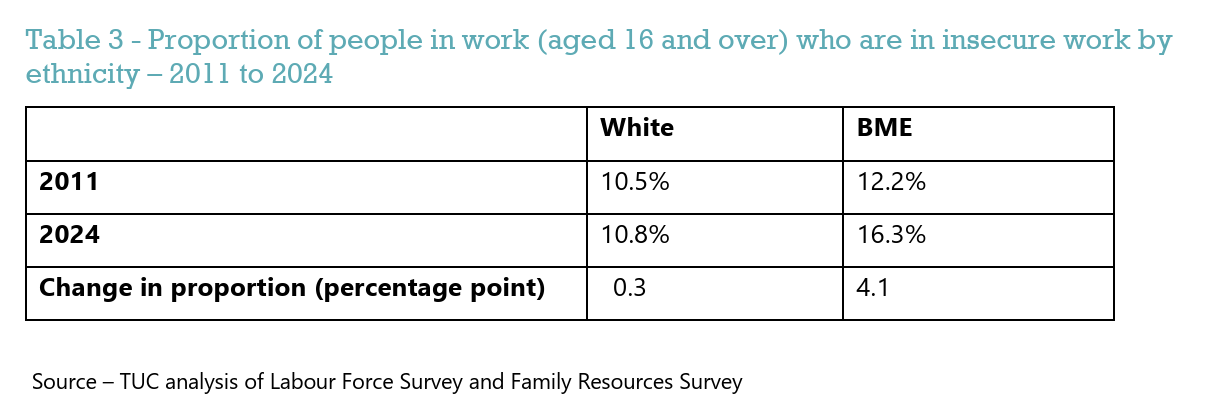
Between 2011 and 2024, the BME employment rate increased by 10 percentage points from 58.9 percent to 68.8 percent, and the employment gap with white workers reduced from 13 percentage points to 7.8 percentage points. At the same time, however, BME workers faced a disproportionate increase in insecure work. BME workers account for just over two-thirds of the net growth in insecure work – despite BME workers making up just 17 percent of workers in the UK.
Looking at the data by ethnicity and gender – an alarming 18.9% of BME men are in insecure work – that is almost one in five BME men.
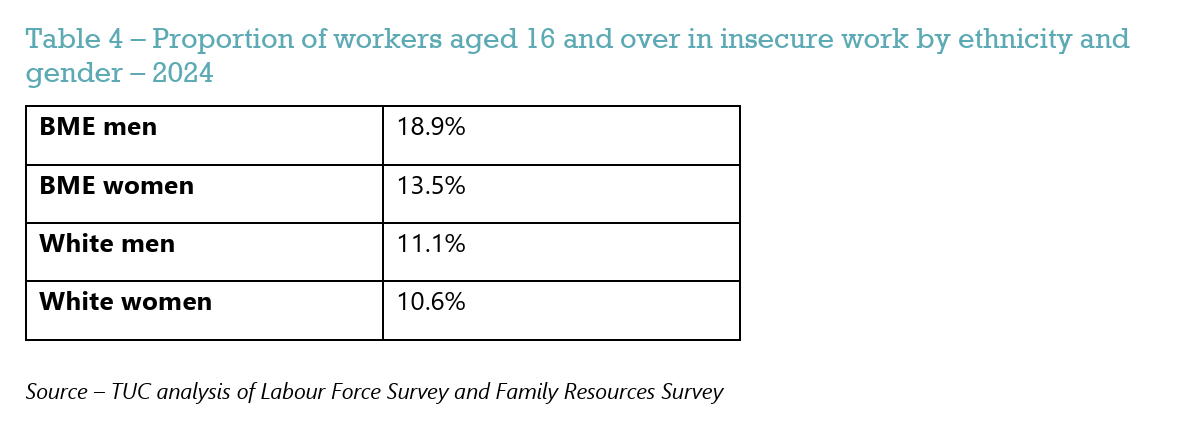
The increase in insecure work for BME workers has been apparent amongst both men and women, though the percentage point increase is larger for BME men, at 5.5 percentage points. During the same period there has been a small fall in white men in insecure work.

Methodology
The total number in ‘insecure work’ includes:
(1) Agency, casual, seasonal and other workers, but not those on fixed – term contracts.
(2) Workers whose primary job is a zero-hours contract. To note – data on temporary workers and zero-hour workers is taken from the Labour Force Survey Q4 in 2011 and 2024. Double counting has been excluded. And data has been used from 2011 rather than 2010 to ensure consistency in Labour Force Survey Questions.
(3) Self-employed workers who are paid below 66% of median earnings – defined as low pay.
The data on the low paid self-employed is from the Family Resources Survey 2010/2011 and 2023/24. The Family Resources Survey suggests that fewer people are self-employed than the Labour Force Survey. And the data from the Family Resources survey looks at from age 18+. Data commissioned by the TUC from Landman Economics
Stay Updated
Want to hear about our latest news and blogs?
Sign up now to get it straight to your inbox
