
Workers should be protected from pensions roulette
Analysis of historic investment returns shows that a pension saver’s pot size can vary by up to 40 per cent due to little more than luck.
A man on median pay who had saved for 40 years in a defined contribution pension before retiring at 65 in 2000 could expect a yearly workplace pension of £16,845. Yet, a colleague with an identical work history retiring two years later would have received £11,761 a year.
Differences are even wider if you consider the roll of the dice savers make on turning their pension pot into an income to live off. In recent years quantitative easing and a lacklustre economy have contributed to a surge in the cost of the traditional route of buying a guaranteed income through an annuity contract.
The retiree in 2000 could have enjoyed an annual income of £27,871 from his pension pot of £306,272, based on prevailing annuity rates. This is more than £12,000 a year extra for life than the £15,183 netted by the man retiring in 2003 with a £213,844 pot.
These huge differences matter because millions have a workplace pension for the first time thanks to rules that automatically enrol most workers into a pension scheme with a compulsory employer contribution.
Yet, defined benefit (DB) pensions, which aim to pay a retirement income based on your past wage and length of service, are increasingly rare in the private sector. In these schemes shortfalls in investment returns are not met directly by savers.
Instead, most current workers in a pension are enrolled into defined contribution (DC) schemes. With these, the final pension pot, and income that can be taken, is related to investment returns as well as the amount contributed. Savings are typically invested in a mixture of company shares and bonds. If returns are poor, this directly affects their standard of living in old age.
The TUC believe most workers want their pension to allow them a decent standard of living in retirement, not a high-stakes gamble on the markets.
These figures strongly suggest that workers should be enrolled in well-governed schemes with the scale and investment expertise to grow their savings while protecting them from the worst of the ups-and-downs of the markets.
Building up a pot
We have shown previously in this series of blogs that workers face a lottery when it comes to being enrolled into a pension. In some industries, such as farming and hospitality, only a minority of workers are in a pension scheme. The amount an employer is prepared to commit to workplace pensions varies widely.
This new analysis, based on data produced by the Pensions Policy Institute (PPI) for the TUC, reveals the extent to which investment returns add another layer of uncertainty and chance.
The PPI found that a man on median pay who had eight per cent of wages being applied to a typical defined contribution (DC) pension for 40 years, would have ended up with a pension pot of £306,272 if he had retired in 2000.
But just a year later, after the Dot.com bubble burst and technology shares plunged in value, 40 years of savings would have given him £18,000 less, some £288,372. The total would have fallen further to £213,844 if the individual retired in 2003.
Returns have subsequently bounced back thanks to recent strong stock markets. A median earning male retiring in 2017 would have netted a pension pot of £305,519.
The analysis is based on a typical DC scheme’s default fund invested 60 per cent in equities and 40 per cent in bonds. The differences in outcome reflect the impact of financial crises where investments resulted in a loss, as well as having money invested in “good” years when overall returns were strong.
Defined contribution pension pot size at retirement for median-earning male in 2017 earnings terms by year of retirement
Turning that pot into an income
The size of pension pot affects the income a retiree can enjoy. Based on 2017 annuity rates for a 65-year-old, the saver retiring in 2000 would have enjoyed a yearly pension of £16,845 and someone retiring in 2016, £16,926.
Yet, the person whose 40 years of saving ended in 2002 would have received a comparatively small £11,761 a year. And a 2009 retiree would have picked up £12,285.
Take into account changes to annuity rates, which are linked to the price of bonds, and the difference is more stark.
The retiree in 2000 could have enjoyed an annual income of £27,871 based on prevailing rates. This is more than £12,000 a year extra for life than the £15,183 netted by the man retiring in 2003 with a £213,844 pot. And even the saver retiring in 2016 would have got just £14,464 a year having purchased a level single life annuity despite his £307,751 of retirement savings.
Defined contribution pot size and indicative income at retirement in 2017 earnings terms by year of retirement. Based on a male median earner-contributing for 40 years
|
Retirement year |
Accumulated pension fund |
Annual Income (£s) (2017 annuity rates) |
Annual Income (£s) (Historical annuity rates) |
|
2017 |
£305,519 |
£16,804 |
£16,804 |
|
2016 |
£307,751 |
£16,926 |
£14,464 |
|
2015 |
£307,265 |
£16,900 |
£17,821 |
|
2014 |
£299,893 |
£16,494 |
£18,593 |
|
2013 |
£284,417 |
£15,643 |
£16,496 |
|
2012 |
£274,989 |
£15,124 |
£15,674 |
|
2011 |
£268,149 |
£14,748 |
£16,893 |
|
2010 |
£248,570 |
£13,671 |
£16,654 |
|
2009 |
£223,357 |
£12,285 |
£16,082 |
|
2008 |
£268,785 |
£14,783 |
£20,428 |
|
2007 |
£275,212 |
£15,137 |
£20,366 |
|
2006 |
£264,299 |
£14,536 |
£19,030 |
|
2005 |
£240,999 |
£13,255 |
£17,111 |
|
2004 |
£231,333 |
£12,723 |
£16,656 |
|
2003 |
£213,844 |
£11,761 |
£15,183 |
|
2002 |
£248,496 |
£13,667 |
£18,140 |
|
2001 |
£288,372 |
£15,860 |
£23,070 |
|
2000 |
£306,272 |
£16,845 |
£27,871 |
The future
Just as investment returns in the past have been volatile, the outlook for future returns on people’s pension saving is also highly uncertain.
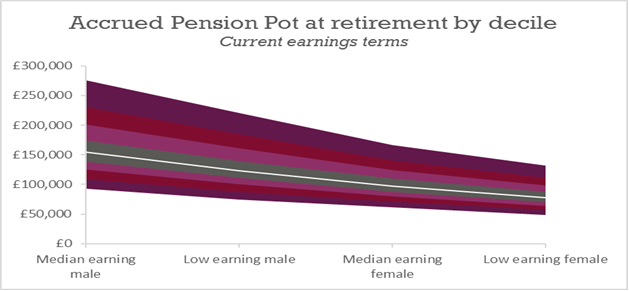
The PPI modelled for the TUC a range of scenarios for median- and low-earning men and women with typical employment patterns. Again, this was based on a typical DC pension default fund invested 60% in equities and 40% in bonds.
There was a huge range in the potential pot size, which are illustrated in the chart below. PPI simulations of future retirement income outcomes found that in the lowest 10 per cent of outcomes, a median-earning male might accrue a pot of £78,757.49 in 2017 terms, enough to deliver a weekly income of £61.82. But in the highest 10 per cent of scenarios, the pot would be £353,123.42. This would pay out £277.19, if an income was bought today.
A median earning female, who it is assumed will take career breaks for caring responsibilities, sees her workplace pension income range from £44.02 in the bottom 10 per cent of outcomes (based on a pot of £56,076.57) to £160.10 for a pot of £203,959.32 at the other end.
And for a low-earning female, the range in weekly income from a private pension is from £35.14 to £126.10.
It is notable that in virtually all scenarios, the income a median or low earning woman receives from the state pension would dwarf what she would get from a private pension, no matter how well markets turned out for her. We will explore the value of the state pension in a future blog post.
Case for reform
We will also give greater attention to policy solutions in future posts. It is notable that the implementation of so-called Pensions Freedom in 2015 means that DC savers are no longer obliged to buy an annuity. This potentially strips out some of problems around fluctuating annuity rates. The flipside is that little has come into its place that helps savers generate an income, and protect them against the risk of their money running out in old age. Many savers will actually be more exposed to the vagaries of markets in retirement because their funds remain invested for longer.
This analysis does suggest that further consideration should be given to the implementation of Collective Defined Contribution pensions. In such schemes the risks (and benefits) of investments not turning out as expected are shared between scheme members. Like DB pensions all savings are paid into a pool, with all pensions paid from the same pool. But unlike DB there is no pensions promise from an employer. Instead, CDC pensions have a target pension that they seek to pay.
There is also the potential that if the government pursues the consolidation of workplace schemes this might deliver some of the potential benefits of CDC. The development of large-scale schemes would deliver benefits of scale with costs shared across a large number of members. They might also be better able to develop diversified investment mandates to reduce volatility by investing in a range of assets, including those that might be difficult to buy or sell quickly.
There are already signs that some of the big providers of automatic enrolment pensions are taking steps to diversify their investments, in part to smooth out returns for investors.
State-backed NEST states in its investment principles that “diversification is the key tool for managing risk”. Hitherto, this has resulted in limited moves, such as taking a position in emerging market bonds. But managers at the provider have talked of moving into areas such as commodities, infrastructure, global credit and private debt.
Likewise, it is expected that NEST’s main rivals will take similar steps as they grow rapidly in size.
If these promises are realised, then workplace pensions will be better placed to deliver to savers a good chance of a decent old age rather than a ticket to an investment lottery.
Image: iStock / Getty Images Plus
Stay Updated
Want to hear about our latest news and blogs?
Sign up now to get it straight to your inbox