TUC submission Autumn Budget 2025
An inheritance of failure
The UK faces an unprecedented set of economic and social challenges: years of poor growth, falling living standards and decimated public services. The drivers include reckless reductions in public capital investment and public service spending; a bad Brexit deal; and a lack of any genuine industrial or labour market policy under the previous Conservative government.
As a result, the Conservatives presided over under-performing labour market, which is still holding back millions of people’s lives and opportunities – as well as depressing growth.
Workers endured the worst pay crisis for two centuries, accompanied by a damaging rise in highly insecure work. Chronic under-investment hollowed out Britain’s industrial communities and too many young people left school without a route to a decent job. Rising numbers of disabled people who could work found themselves without support to do so.
Significant public services cuts were regressive, with those on the lowest incomes seeing the most significant drops in their living standards as services fell away.
The Tories’ disastrous failure also meant a steep increase in public debt. Coupled with high interest rates, government interest payments have risen very steeply.
Investing in change
A commitment of £325bn on government capital spending and public services investment has started to repair damage the last government caused. But while these important improvements are welcome, they are not sufficient. More investment not less is needed to put the UK economy on a firmer footing and to repair our public services.
Capital investment commitments must be protected, and thought should now be given to how they can be further expanded – including ensuring the National Wealth Fund has powers to borrow.
It is welcome that our trading relationship with Europe has begun to improve, and the TUC supports government ambitions to secure commitments in the Common Understanding as soon as possible.
While policymakers continue to misjudge a failure of demand for a failure of supply, the operation of the fiscal institutions the government inherited, in an internationally volatile climate, does place real constraints on what can be borrowed to invest now. So significant action is needed to raise revenues.
Now is the time to address historic imbalances in how labour and capital are taxed. This should include a significant increase in the bank surcharge, further substantial capital gains tax reform and increased taxation on gambling companies. A fairer balance of taxation would raise significant revenues to support the investment and public services spending that will underpin future productivity gains, and protect the incomes of working people whose consumption is also essential for secure growth.
The government must also ensure that its approach to managing the public finances in the longer-term is conducive to securing strong, sustained output gains – an independent commission should now be established to consider how the processes for managing our public finances should continue to evolve, considering best international practice as well as recent UK outcomes.
Raising living standards
In this challenging context, faith in government’s capacity to deliver change is extremely low. After years of life getting harder, frustration with the pace of change is high.
The country is in desperate need of repair and renewal. And while the last 12 months have starkly shown that there are no quick fixes or easy answers an ambitious approach is now needed to securing change that is seen and felt in daily lives.
The living standards crisis has not gone away – it remains the most significant issue facing working people across the country. Real pay is still barely advanced on 2008, despite some small gains over the past year. While around 30 per cent of the public do now report that the pressure on their household budgets is easing, most (58 per cent) do not.1
After the most severe living standards pressures on historic record, it is no surprise that most people’s budgets feel much tighter than they used to. The government must now be relentless in showing working people it is on their side and that it is doing all it can to help families bring down their costs and increase their incomes.
Taking measures in the service of working people’s incomes is not just essential to delivering on a mandate for change, but the right way to rebuild our economy. A focus on stronger growth and rising living standards must go hand in hand.
The UK needs to break free from its persistent recent cycle of stagnant GDP and falling real household incomes. While higher GDP per head is needed to secure more better jobs and higher wages, rising consumer incomes and subsequent higher spending also make an important ongoing contribution to our economic health. Economic policy must simultaneously target both stronger output and rising living standards.
So immediate action must be taken to help working people with the cost of living, including introduction of measures to bring down domestic energy costs, an end to the two-child benefit cap and ongoing ambition on the minimum wage.
A joined-up labour market policy should also be central to the government’s approach - focusing consistently on more and better jobs.
Young people, taking their crucial first steps into paid work at the end of full-time education, have finally been promised a guarantee of quality training or a decent first job. This must be ambitious scheme, with early access for those who need it most. We also need to invest more in learning, prioritising expansion of the Growth and Skills Levy and a new union learning fund to boost union-employer partnerships.
Full implementation of the employment rights bill, and the wider plan to Make Work Pay, are an essential part of the job quality agenda and will also support stronger growth. Our assessment suggests that the employment rights bill alone will improve job security for millions of workers and delivering annual net economic gains of around £10bn a year. As the Bill gains Royal Assent it must now be delivered at pace, ensuring working people see real benefit from the changes it brings and that the economic gains it can deliver are fully felt.
The new industrial strategy has started to deliver investment and futureproof our manufacturing base, while boosting our capacity to compete for the new industries of tomorrow. More action can now be taken to ensure there are strong workforce strategies in place across each sector. This approach can be carried across to significant infrastructure investments, where employers and unions should be supported by government to secure framework agreements across significant infrastructure projects, promoting secure jobs and high labour standards.
Support is also needed across foundation industries to ensure competitive industrial electricity prices – this should include bringing forward the British Industrial Competitiveness Scheme or failing that introducing an interim support scheme to be available to industry on the brink of closure due to energy costs. Additional funding and investment is also needed to futureproof North Sea supply chain firms and deliver a successful workforce redeployment programme for jobs at risk.
Decent public services play a vital role in boosting productivity, growth and living standards – whether through improving the nation’s health, boosting educational performance or ensuring that people with caring responsibilities are able to work. It is therefore vital that investment in the world class public services we need is sustained, and that there is active dialogue with public service unions on a plan to restore public sector pay, recognising that more than a decade of pay restraint has exacerbated the recruitment and retention crises across much of the public sector and the financial hardship faced by many public services workers.
Investing in our infrastructure, skills and public services is not just the right thing to do for individual workers, but to deliver the environment in which growth can thrive. More and better jobs across our country, together with action to tackle the cost-of-living crisis, are the best way to deliver a more secure, productive economy. A government that delivers for working people will be one that can deliver the repair, renewal and growth the country desperately needs.
- 1TUC polling August 2025, undertaken by Hold-Sway, n=5024.
The urgent need for change
- The government took power amidst unprecedented economic and social challenges
- The country is facing simultaneous failures on growth, living standards, (across measures of job quality and employment rates as well as wages), post-Brexit trade, investment and public services.
- The living standards crisis has not gone away – it remains the most significant issue facing working people across the country.
- The government is right to target both stronger growth and rising living standards – both goals are mutually supportive.
- Chronic under-investment has hollowed out Britain’s industrial communities, and too many young people are leaving school without a route to a decent job or secure future.
- Public service performance went consistently backwards, and Tory failures on growth meant they also failed on public debt.
The UK faces an unprecedented set of economic and social challenges – years of poor growth, falling living standards and decimated public services.
We do know that stronger growth and rising living standards must go hand in hand. The UK needs to break free from its persistent recent cycle of stagnant GDP and falling real household incomes. While higher GDP per head is needed to secure more better jobs and higher wages, rising consumer incomes and subsequent higher spending also make an important ongoing contribution to our economic health. The government is right focus their growth mission on achieving both rising real household disposable incomes and higher GDP per head2 : economic policy must simultaneously target both stronger output and rising living standards.
Evidence shows us that change is possible, and that progress has already started. But the failures inherited from the Tories have been worsened by ongoing and strong headwinds from abroad and at home. Conservative failures to reduce public debt, coupled with high interest rates, are acting as a severe restraint to private and public sector activity.
A crisis of growth and living standards
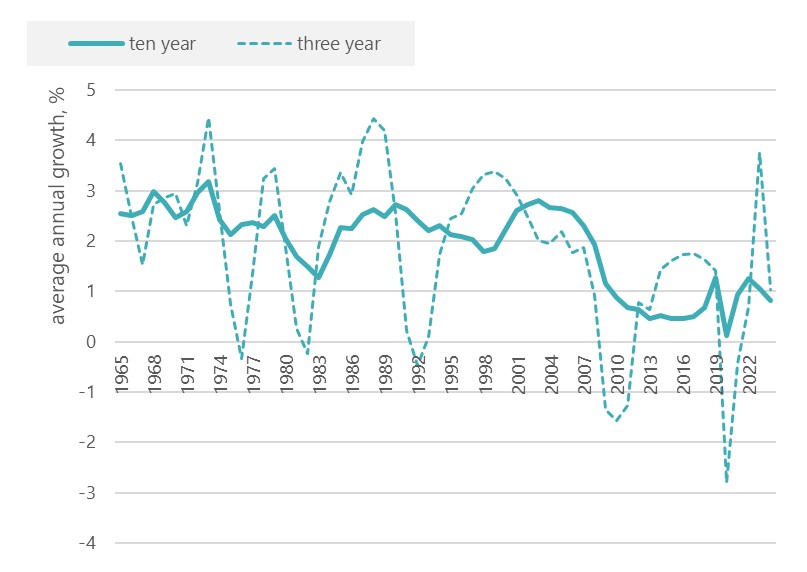
Following the financial crisis, output per head saw a dramatic fall. After a small improvement pre-pandemic, the post-covid period saw further falls. Average annual growth of GDP per head has only been one per cent over the last three years.
Chart 1: GDP per head growth, moving averages
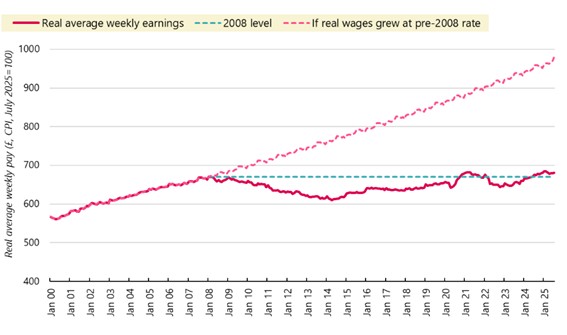
At the same time, under the Tories workers endured the worst pay crisis for two centuries.3 Average weekly earnings adjusted for inflation show that real pay grew by an average of just 0.04 per cent a year between May 2010 and April 2024. Overall, real pay growth averaged a welcome 3.1 percent over the last (financial) year, but it has fallen back more recently as inflation picked up with bills rising into the new financial year (discussed in more detail below). Real average weekly pay remains up by only £9 (1.4 per cent) on the 2008 peak. Had pay instead grown in line with the pre-global financial crisis trends since January 2008, average weekly earnings would now be £298 per week higher.
Chart 2: level of real pay, July 2025 (CPI) prices
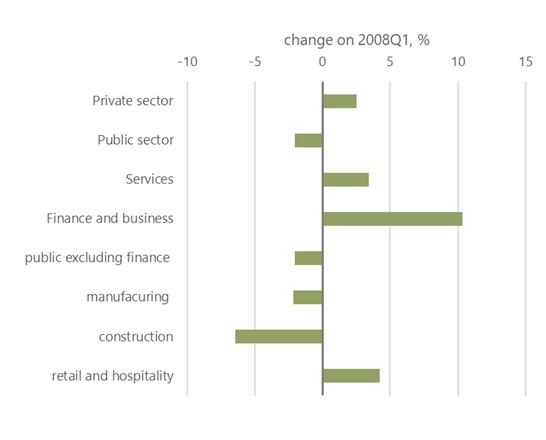
For many workers the reality is even worse, with real pay still below the 2008 level. While finance and business services are now seeing real pay 10 per cent above 2008, hospitality is up by a lower 4 per cent (and from a very low base). Workers’ standard of living in other vital industries has still gone backwards, not least those in manufacturing, construction and the public sector. The living standards crisis has not gone away – it remains the most significant issue facing working people across the country.
Chart 3: industry change in real pay since the global financial crisis (CPI basis)
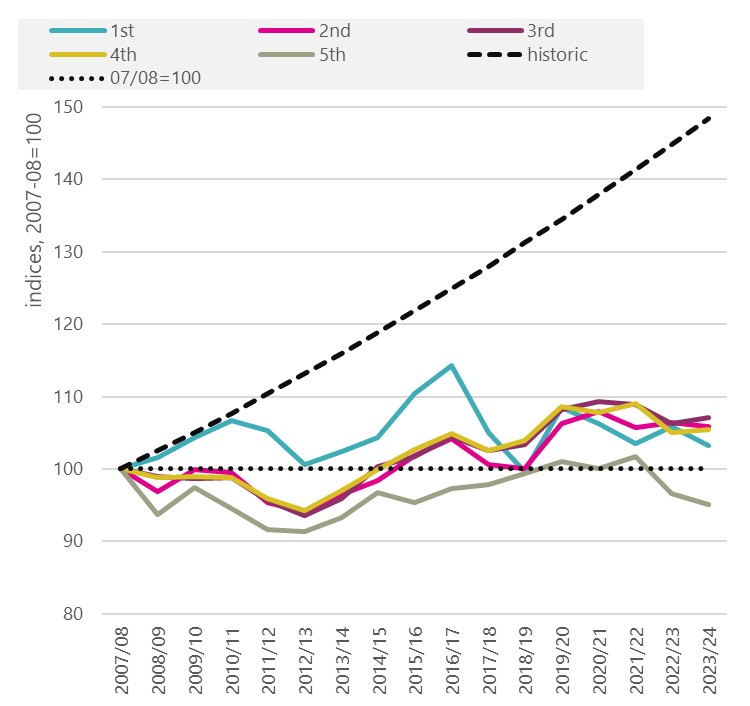
While of great importance, real pay figures also only provide a partial picture of incomes, and do not cover the whole population. ONS figures for the disposable income of individuals include self-employed and retired people and consider taxes and benefits. Chart 4 shows some gains ahead of the pandemic, but real incomes then falling for all quintiles over the last three years under the Tories (the data extend to 2023-24). As with pay, incomes have fallen disastrously short of the pre-financial crisis trend.
Chart 4: median real household disposable income by income quintile
Labour market underperformance
At the same time, the quality of work has deteriorated. TUC analysis has shown that in 2024 there were four million people in insecure work, up from 3.2 million in 2011. As a share of the workforce, insecure work grew to 11.7 from 10.7 per cent.
The increase in insecure work has been disproportionate to the rise in the employment level: insecure work grew by 25 percent compared to 15 percent employment growth (table 5).
Table 5: Insecure work 2011 and 2024
| 2011 | 2024 | Change from 2011-2024 | |
| Numbers in insecure work (16 +) | 3.2 million | 4 million | +25 percent |
| Employment Levels (16 +) | 29.4 million | 33.9 million | +15 percent |
Source: TUC analysis of Labour Force Survey and Family Resources Survey4
Insecure work has an enormous effect on people at work. The prospect of having work offered or cancelled at short notice makes it hard to budget household bills, plan wider life and meet caring responsibilities. Insecure work is also low paid in comparison to permanent employment, leaving many insecure workers struggling financially.
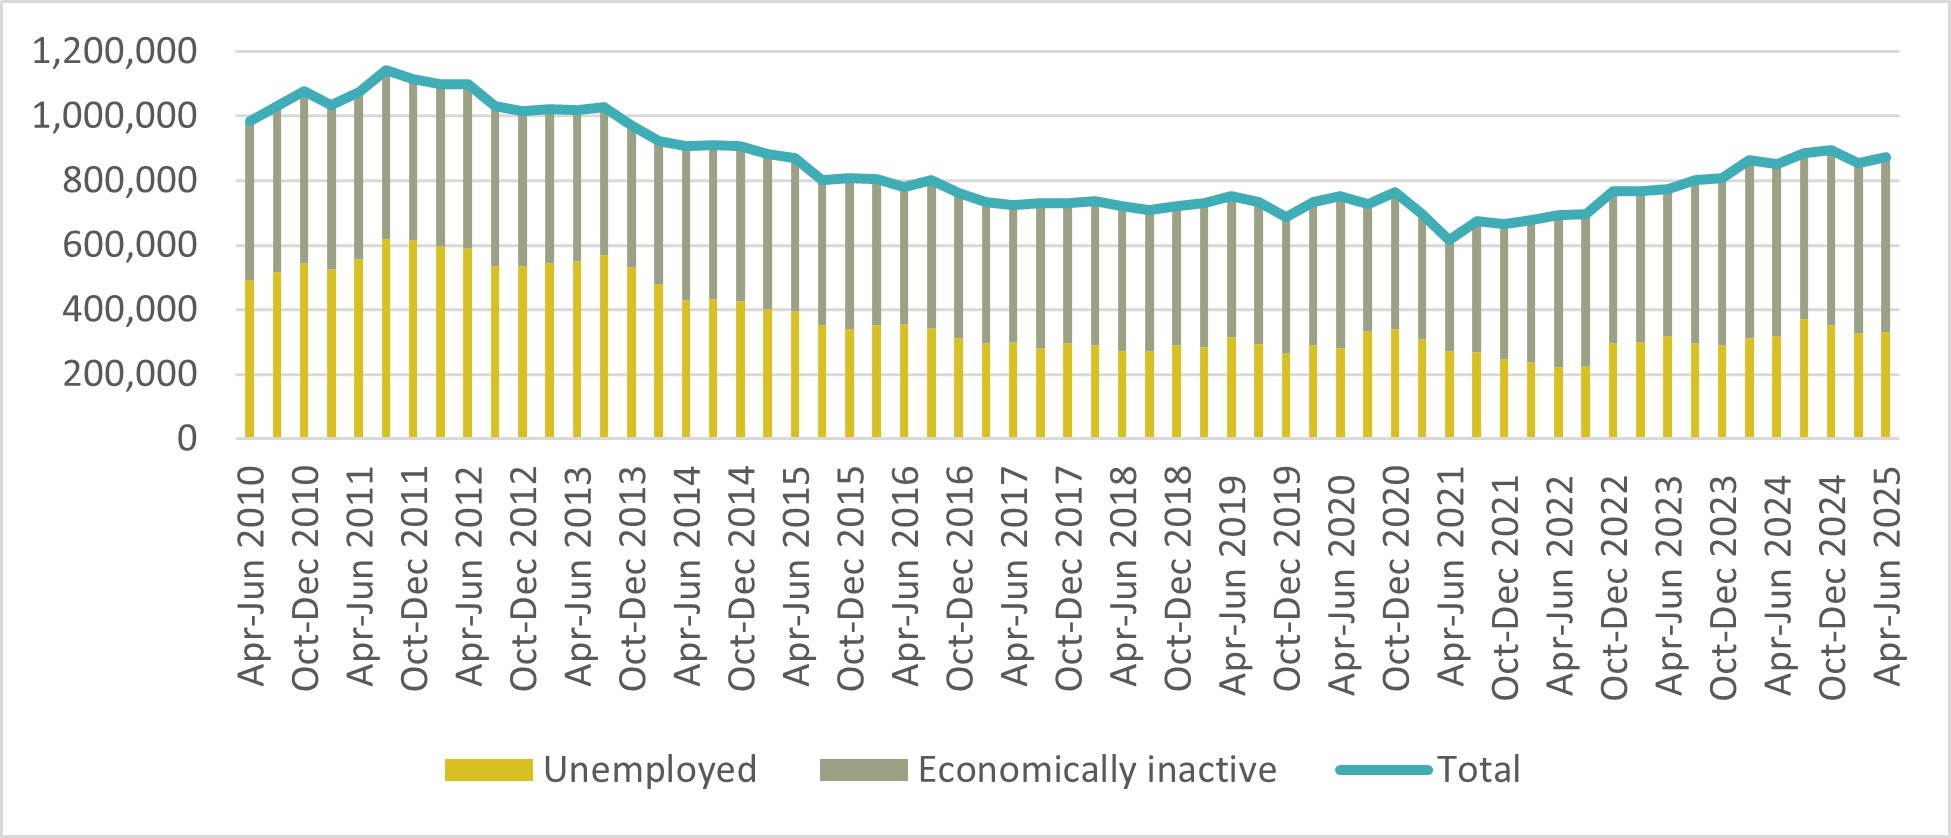
Another Tory legacy is the rising numbers of young people not in Education, Employment or Training (NEET). The latest NEET data shows 873,000 18–24-year-olds are NEET, 948,000 if 16-18 year olds are included. This total been rising since mid-2021 and peaked in October to December 2024, the highest it had ever been since the end of 2014.
Chart 6 shows, compared to the early 2010s where NEET numbers were driven more by young people who were unemployed, NEET young people are now increasingly economically inactive, reporting that they are both out of work and not seeking it. Of the 873,000 18–24-year-olds who are NEET; 330,000 are unemployed (38 per cent) and 543,000 (63 per cent) are economically inactive.
Chart 6: Neet composition of 18–24-year-olds, UK, by unemployment and inactivity.
- 4‘The scale of insecure work in the UK’: insecureworkbriefing2025.pdf
Economic inactivity has also risen for the working population as a whole. Ahead of the pandemic, 2.11 million were inactive due to long term sickness – a total that now stands at 2.79 million, down very slightly from a peak of 2.86 million at the end of 2023. Evidence shows that increased flows from work into inactivity are an important driver of this trend.5
Negative impacts of Brexit
Workers continue to suffer from the damage caused by the Conservatives’ bad Brexit deal which has had a severe negative impact on the UK economy and businesses. Between 2021 and 2023, exports to the EU were down 27 per cent and imported goods down 32 per cent.6 The National Audit Office reports that the annual estimated cost to business of completing customs declarations required by leaving the EU stands at £7.5 billion while it cost taxpayers £4.7 billion to set up new border and customs arrangements. 7
The Office for Budget Responsibility (OBR) has provided a detailed analysis of the potential growth impact of Brexit on the UK economy. They have concluded that Brexit will reduce long-run productivity by 4 percent relative to remaining in the EU. 8
Leaving the EU had a severe negative impact specifically on investment. Haskel and Martin (2023) estimate it lowered investment by 10 per cent9 while other studies suggest that with the current agreement with the EU investment will fall by 32 per cent by 2035.10 This has been driven in part by the loss of the European Investment Bank which, among other areas, supported investment in manufacturing and clean energy.
Investment failures
Growth has been further held back by Conservative failures on capital investment. Upon taking office, the Conservatives immediately cut public infrastructure spending, at a time when the recovery inherited from the Labour government was still fragile. In 2018, TUC analysis showed UK investment third from bottom of all OECD countries, and coming in the bottom half of OECD countries for all broad categories of investment.11 The IPPR has shown business investment “ranking a lowly 28th among 31 OECD countries”, and the lowest in the G7 for three years running to 2022. 12
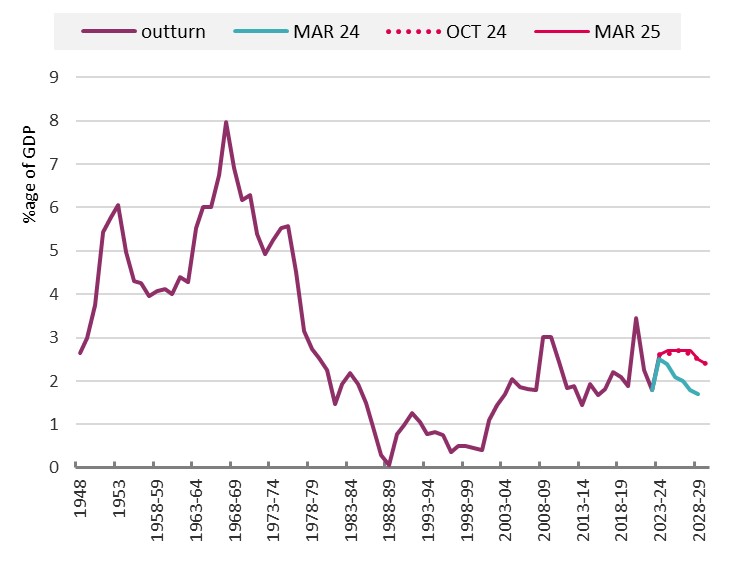
Public sector net investment averaged only 1.8 per cent of GDP over 2010-11 to 2014-15 (chart 7). The figures spiked momentarily during the pandemic at 3.4 per cent of GDP. But afterwards the Conservatives planned for a gradual fall to 1.7 per cent – the joint second lowest figure in 25 years.
Chart 7: Public sector net investment, % GDP
- 5Resolution Foundation, July 2025: Opening-doors.pdf
- 6‘Unbound: UK Trade post-Brexit', Jun Du, Xingyi Liu, Oleksandr Shepotylo and Yujie Shi, 2024:https://www.aston.ac.uk/sites/default/files/2024-09/Full%20Report.pdf
- 7National Audit Office, ‘The UK border: Implementing an effective trade border, 2024: https://www.nao.org.uk/wp-content/uploads/2024/05/the-uk-border-impleme…
- 8Brexit analysis - Office for Budget Responsibility; last updated July 2025.
- 9https://www.economicsobservatory.com/how-has-brexit-affected-business-i…
- 10Cambridge Economics, January 2024: https://www.camecon.com/case-studies/greater-london-authority-impacts-o…
- 11https://www.tuc.org.uk/blogs/uk-third-bottom-global-investment-league
- 12’Rock bottom: low investment in the UK economy’, June 2024: https://www.ippr.org/articles/rock-bottom
Capital investment is critical to economic capacity and to growth prospects into the future. Investment failures of the past 15 years have meant weaker economic growth, weaker revenues and so have further damaged the public finances. Moreover, the IPPR have recently argued there are critical synergies between the private and public sector: “the consensus on investment is shifting – public investment can crowd in business investment”. 13 At the Labour Party 2025 conference, the Chancellor reiterated the point:
- 13Rock bottom
I have never believed the Tory mantra that the best thing that a government can do is to get out of the way. A strategic state must use its power to support jobs and growth – and that includes public investment. Under the Tories, capital spending was always the first victim when the public finances came under pressure. So, in last autumn’s Budget, I changed those fiscal rules – to support and to protect investments.
We urgently need a reset that ensures strong and sustained growth in both public and private investment outcomes.
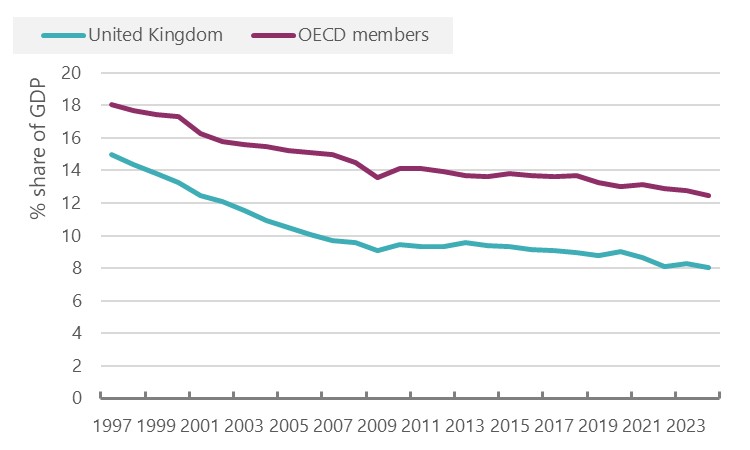
Chronic under-investment and chaotic industrial policy-making led to deindustrialisation. Foundation manufacturing sectors and supply chains were offshored, while the UK struggled to attract new high-tech, advanced manufacturing or clean power manufacturing operations. The overall and steep decline in manufacturing as a share of the economy continued; chart 8 compares the UK with the average for all advanced economies.
Chart 8: Manufacturing as a share of GDP
Under the Conservatives, the government’s policy aimed for a climate transition that prioritised public investment-backed technology development and manufacture in other countries, with the UK’s role as a consumer of technology. For example, in offshore wind the UK’s leadership in deployment was associated with a failure to deliver jobs and domestic economic benefit.
Public services failures
Spending on public services was also decimated under the Conservatives. These simultaneous cuts in infrastructure and wider public spending were disastrous for services in their own right, and also held back the economy and therefore created further pressure on public debt. By 2018-19 the widely used real terms per head measure showed departmental spending down 15 per cent from £6,700 to £5,745. After an increase during the pandemic, spending was cut back sharply again and for 2024-25 was projected still to be 5 per cent below the 2009-10 position.
These cuts were severely regressive. For example, analysis by Landman Economics of the impact of planned cuts for the 2015-2020 parliament showed “The average reduction in living standards as a result of all the modelled tax, transfer and public spending measures is around 13 percent for the bottom decile and around 11 percent for the second and third decile. Meanwhile, for the top decile the average change in living standards are close to zero”. 15
The cumulative loss over the past 15 years has been immense. In July 2024, as the Labour government took office, an Institute for Government report set out “...that the government’s inheritance on public services is extremely precarious. Most services are performing worse now than they were in 2010 or before the pandemic. The government’s status quo spending plans from April 2025 onwards will likely mean that all services other than general practice, hospitals and schools could be performing worse in 2027/28 than in 2010" 16
Public finance failures
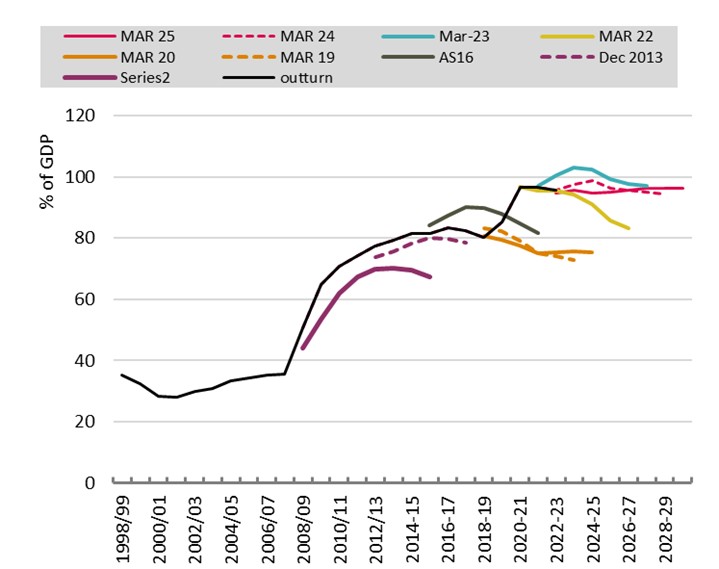
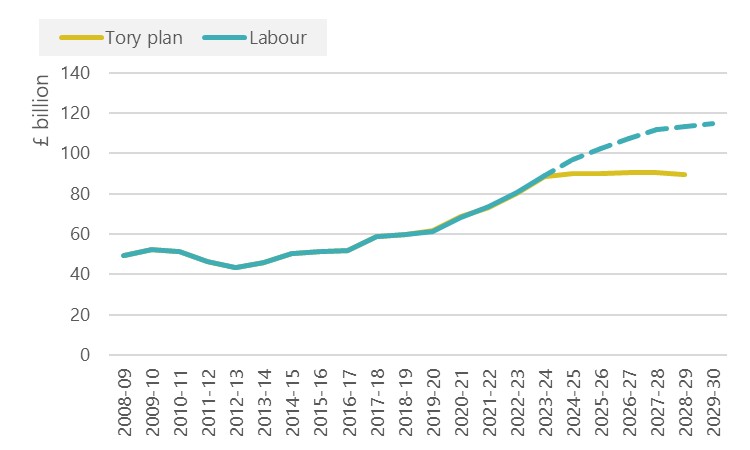
Sustained failures on growth have also had significant impacts for public debt. With our economy so much smaller than anticipated, government revenues have fallen below forecast and our debt has increased as a proportion of GDP. Chart 9 shows badly the Conservatives failed against meeting the targets they set themselves in June 2010.
The plan was to reduce public sector net debt as a share of GDP to 67 per cent by 2015-16. But instead in their March 2024 forecast the OBR reckoned the ratio to be 98.8 per cent of GDP in 2024-25. While the latter figure has obviously been affected by the pandemic, TUC analysis showed the failure on public debt ahead of the pandemic the worst in at least a hundred years.17 In March 2025 the OBR judged that public sector net debt will be at 96.1 per cent of GDP in 2029-30.
Chart 9: Public sector net debt
- 15March 2016: https://www.tuc.org.uk/sites/default/files/Spending-cuts-Report.pdf
- 16’Fixing public services: Priorities for the new Labour government’: Fixing public services | Institute for Government https://www.instituteforgovernment.org.uk/publication/fixing-public-ser…
- 17The Conservatives are presiding over the worst period of economic growth since the 1920s | TUC https://www.tuc.org.uk/news/tuc-conservatives-are-presiding-over-worst-…
This failure continues further to constrain the actions of the current government going forwards, with the position even more challenging given the steep rise in interest costs (discussed in further detail below).
Starting to rebuild Britain - in challenging times
- The country is in desperate need of change and national renewal – and the government has started to deliver change.
- Important commitments on government capital spending and public services investment have started to repair the damage of 14 years of Conservative failure.
- Public sector net investment is now set to rise to 2.7 per cent over 2024-25 to 27-2028. Real departmental spending per head is set to rise to 3.0 per cent above the 2009-10 level in 2029-30.
- Maintaining and building on these commitments in the years ahead will be vital to sustaining growth and boosting living standards.
- Our relationship with Europe has also begun to improve. But although government action is supporting growth, a challenging international context is holding our economy back.
- Consumer demand is depressed and is also pressing down on output.
- High interest rates are holding back growth, and the case for further cuts is strong.
- High interest rates are also impacting the public finances and holding back spending, as the higher Bank rate feeds through to the borrowing costs of government – which are significant given the debt burden inherited from the Tories.
The country is in desperate need of repair and renewal – and the government has started to deliver change. But the last 12 months have starkly shown that there are no quick fixes or easy answers. We still face significant challenges, the scale of which has become starkly clear over the last year. Budget 2025 must now take this formidable task on.
Capital spending boosted
At the 2024 Autumn Budget the government boosted public service and public investment by £326bn – the biggest real terms increase since the 2000 spending review. 18
The increase in government investment spending is shown as a share of GDP on chart 7 above. Rather than falling to 1.7 per cent in 2029-30 (as the Conservatives planned), the latest assessments show public sector net investment is now set to rise to 2.7 per cent over 2024-25 to 27-2028. Chart 10 shows the OBR assessment in gross, cash terms – the rise in investment since 2023-24 totals a cumulative £110bn. The Institute for government pinpoints the beneficiaries: “... big increases in investment spending for energy and net zero, transport, and business – in support of [Reeves’s] missions to grow the economy and decarbonise the energy system – as well as defence”.19
Chart 10: General Government gross fixed capital formation, £ billion
- 18Chancellor provides £326 billion boost to public services and investment, funded by the biggest tax rises on record and higher borrowing • Resolution Foundation https://www.resolutionfoundation.org/press-releases/chancellor-provides…
- 19https://www.instituteforgovernment.org.uk/comment/spending-review-2025
Public service improvements, although more investment needed
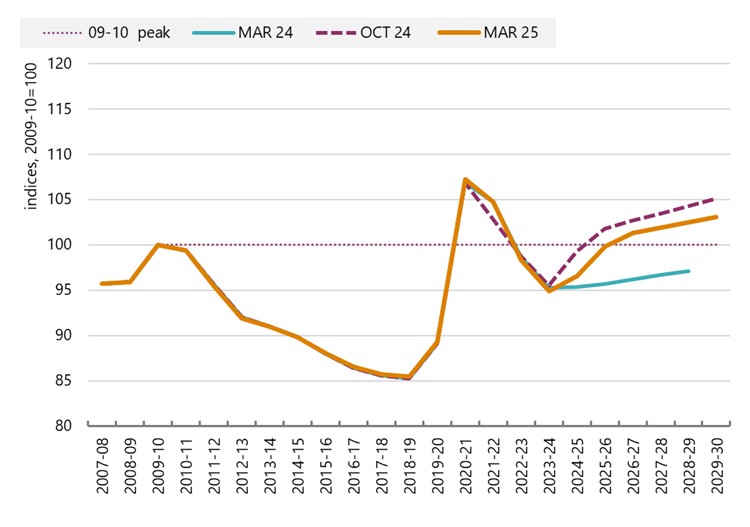
Public services spending was decimated under the Tories. Chart 11 shows a decline of 15 per cent on the real terms per head measure, and the further slump in spending the Conservatives planned following the pandemic. The latter meant a renewed decline to 5 per cent below the 2009-10 position.
Under the current government real departmental spending per head is set to rise to 3.0 per cent above the 2009-10 level in 2029-30. The International Monetary Fund has confirmed the government was right to raise revenues to support this investment.
The authorities’ fiscal plans strike a good balance between supporting growth and safeguarding fiscal sustainability. The new spending plans are credible and growth-friendly, taking account of pressures on public services and investment needs. They are expected to provide an economic boost over the medium term that outweighs the impact of higher taxation. As revenue is projected to increase, deficits are set to decline and stabilize net debt.
Chart 11: Real departmental spending per head, 2009-10=100
In the context of poor growth, public spending is also supporting jobs. Payrolls figures show private sector jobs falling from the start of 2024, but the declines offset by gains in public sector employment.
Current spending increases are also badly needed, but they do fall short of the full investment necessary to turn services around and drive improvements. Current spending has been focused on health, which has meant smaller real terms increase in education and other departments.21
After years of real terms falls and freezes, public sector pay awards in 2025 were broadly in line with inflation (when announced), building on the above-inflation pay awards in 2024 and helping to reduce the gap between public and private sector pay growth.22 Welcome steps have also been taken to put the Pay Review Body timetable back on track, so that many public service workers will start to receive their pay awards on time within this parliament. This will provide clarity and certainty to workers about the timings of pay awards, as well as minimising the risk of administrative issues and complications arising from interactions with social security payments and increases to the national minimum wage (NMW). The start of talks to negotiate structural changes to the Agenda for Change contract are also welcome, and NHS unions have been clear that the promised funding must cover the agreed outcomes in full.
But workforce recruitment and retention challenges remain endemic across much of the public sector, albeit with some evidence to show that high vacancy rates are abating. As of the end of June 2025, there were 102,576 vacancies in the NHS – almost 11,000 fewer than the previous year but still very high.23 The National Foundation for Education Research (NFER) annual Teacher Labour Market report found that the unfilled vacancy rate for teachers is six times higher than pre-pandemic, while 3.9% of teaching posts in further education were vacant at the end of the 23/24 academic year. 24 25
The impact of pay erosion has had severe cost of living consequences for many public sector workers. UNISON estimates that the average public sector worker saw the real value of their wage fall by over £11,000 in 2024 compared to 2009, with unions reporting that public sector workers feel that rises to their household costs - including mortgage repayments, energy bills, and childcare - significantly outpace pay increases.26 The effects on workers’ wellbeing should not be underestimated – for example, almost one in eight teachers have been forced to take a second job to supplement their income. 27
Improving relations with Europe offset by international headwinds
Importantly, relations with the European Union have started to be repaired. The government has placed a welcome priority on building a closer relationship with the EU, which is crucial to protecting good jobs, locking in the highest standards of workers’ rights and providing the UK with a powerful and reliable partner with which to face global instabilities and challenges.
The agreement of the Common Understanding in May was welcome, and while further rapid progress is needed, these commitments have potential to boost both growth and living standards. 28
In the first half of the year UK growth at 1.0 per cent was the fastest in the G7.29 But the wider economic context remains challenging. The USA’s economic policy has created turbulence and uncertainty around external demand and high UK interest rates continue to constrain internal demand. The Bank of England are also warning of threats to financial and economic stability, including from the “stretched” valuation of technology companies focused on AI.30
Stronger government current and capital expenditure are protecting the economy in the face of these risks but cannot fully migrate them. The latest monthly figures into July show quarterly GDP growth slowing to 0.2 per cent. The Bank of England judge the underlying rate of growth is around 0.25 per cent a quarter.
Consumer demand remains depressed by the living standards shock
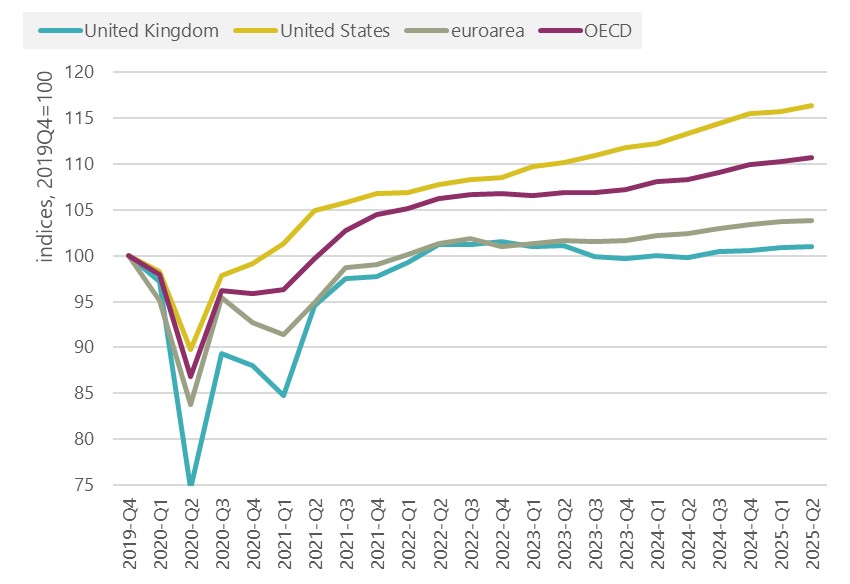
The most significant challenge the UK economy faces remains depressed consumer demand, with the latest figures showing it stagnating for three years. Since the financial crisis, consumer spending has generally accounted for around two thirds of GDP growth, but over the last two years has made no contribution at all. Improving workers’ living standards is vital for driving improvements in economic performance.
The situation in the UK is more challenging than in most advanced economies. Consumer spending in the UK is only up only 1 per cent on 2019 Q4, compared with 16 per cent in the US, 11 per cent across all advanced economies (OECD) and 4 per cent in the euroarea over the same period (chart 12).
Chart 12: Household expenditure, indices (2019Q4=100)
- 21https://www.resolutionfoundation.org/press-releases/britain-is-turning-…
- 22https://www.resolutionfoundation.org/press-releases/britain-is-turning-…
- 23NHS England, 2025: NHS Vacancy Statistics England, April 2015 - June 2025, Experimental Statistics https://digital.nhs.uk/data-and-information/publications/statistical/nh…
- 24Department for Education, 2025: Further Education Statistics https://explore-education-statistics.service.gov.uk/find-statistics/fur…
- 25Department for Education, 2025: Further Education Statistics https://explore-education-statistics.service.gov.uk/find-statistics/fur…
- 26’Bargaining on annual pay rises’, 2025: https://www.unison.org.uk/content/uploads/2024/11/Pay-claims-0125.pdf
- 27‘Supplementary Submission to the School Teachers’ Review Body‘, NASUWT, 17 January 2025
- 28https://www.gov.uk/government/publications/ukeu-summit-key-documentatio…‘, NASUWT, 17 January 2025
- 29GDP quarterly national accounts, UK - Office for National Statistics; table 5. https://www.ons.gov.uk/economy/grossdomesticproductgdp/bulletins/quarte…
- 30Record of the Financial Policy Committee meeting on 2 October 2025: https://www.bankofengland.co.uk/financial-policy-committee-record/2025/…
Flat spending indicates that workers remain under significant pressure. ONS polling shows that the cost of living (87%) remains the most important issue facing the UK (along with the NHS (82%) and the economy (70%)). 31 Survey data from the middle of the year show around one in four (24%) of adults reported that they had found it very or fairly difficult to get by financially in the past month; and two in five (40%) adults reported spending less on food shopping and essentials; this increased to 71% for those who were more likely to be financially vulnerable.32
Interest rates are unnecessarily high and are holding the economy back
While the Office for Budget Responsibility is reportedly revising its assessment of future potential productivity growth, our analysis suggests that the weakness of the UK economy follows from the weakness of aggregate demand. Attributing demand-driven weakness to the supply-side of the economy has been a constant and greatly problematic feature of policymaking since the start of austerity in 2010. 33
This is exacerbated by the Bank of England’s assessment of the position on inflation. Ongoing high interest rates are pressing down on growth, but making little impact on inflation. At 4 per cent interest rates in the UK are double those in the EU and on a less definitive trajectory to the USA (at the start of September the Federal Reserve reduced their 'target range' to 4-4¼% and signalled further reductions).34
While higher prices have meant that wages held up over the last year, as workers tired to stay afloat, spending is flatlining. Lower interest rates are urgently needed to boost demand.
Those who maintain that higher rates are needed focus on higher inflation in the UK than our international competitors. But this assessment does not take account of the fact that most of the higher inflation rises in the UK are due to utility prices.35 Chart 13 shows that the contribution of electricity, gas and water at 0.72 ppts outstrips the rise in overall (CPIH) inflation between March and August 2025. The other key upward pressures are from food, which is driven by international commodity markets (notably coffee, chocolate and beef), a little on transport, though significantly reduced from July with the upward impact from air fares reversing, and only a small contribution from everything else. This latter category might include employer NICs, showing that while the costs are of course real for employers they are not significant factor driving higher inflation.
Chart 13: Contributions to change from March 2025 in CPIH inflation, ppts
- 31Public opinions and social trends, Great Britain - Office for National Statistics; 19 September 2025. https://www.ons.gov.uk/peoplepopulationandcommunity/wellbeing/bulletins…
- 32https://www.ons.gov.uk/peoplepopulationandcommunity/wellbeing/bulletins…
- 33’Productivity: no puzzle about it’, TUC, February 2025: https://www.tuc.org.uk/sites/default/files/productivitypuzzle.pdf
- 34’Federal Reserve issues FOMC statement’, 17 September 2025: https://www.federalreserve.gov/newsevents/pressreleases/monetary2025091…
- 35The relevant level of detail is only available for CPIH, where the overall increase in inflation between March and August is lower at 0.7 ppts, given a large downward effect from owner occupiers‘ housing (which is not included in CPI).
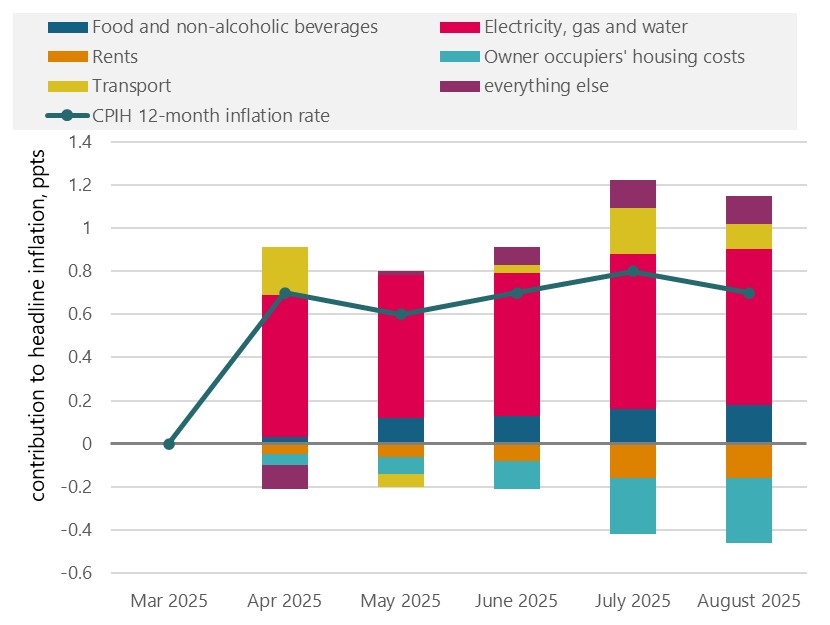
In a recent speech Sarah Breeden (Deputy Governor, Financial Stability at the Bank of England) deployed a similar chart, and concluded that “the current “hump” has been driven by external shocks that are not a reflection of domestic inflationary pressures”. 36 Given there is little evidence of domestic inflationary pressure, along with significant falls in consumer demand, the case for keeping interest rates high seems highly questionable. We judge these high rates are severely damaging economic growth, to no obvious gain in terms of the inflation picture.
High interest rates are also impacting the public finances, as the higher Bank rate feeds through to the borrowing costs of government. The OBR shows payments up £75bn a year or trebling since before the pandemic. Over 2025-26 to 2029-30 government interest payments are expected to average £113bn a year; in the five years to 2019-20 interest payments averaged £38bn. 37
Chart 14 shows the UK along with the US having the steepest increase in the share of GDP allocated to interest payments (with figures only to 2023).
Chart 14: Government debt interest payments, % GDP
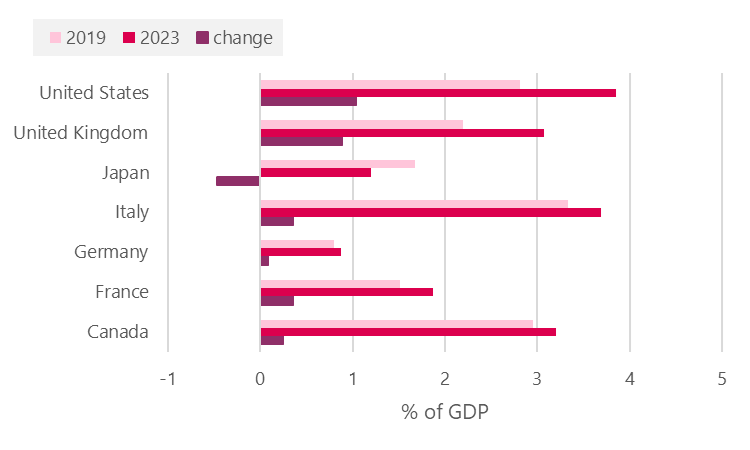
High interest rates have had significant implications for the debt burden inherited from the Tories. Overall debt interest payments depend on both the stock of government debt and the rate of interest on that debt. The relationship between the two quantities is complex. Government borrowing costs rocketed when the Bank of England raised interest rates, and projected future interest payments have further repercussions on the level of public debt going forward. But there is a vicious circle, to the extent that higher debt servicing costs mean that higher public debt is then regarded (not least by financial markets) as a bigger problem.
High interest rates also depress both private and public expenditure, and further damage economic growth. In the past the TUC has referred to a doom loop, when policy actions with the stated purpose of improving the public finances prove counterproductive. 36
- 36’From the doom loop to an economy for work not wealth’, TUC, 2023: https://www.tuc.org.uk/research-analysis/reports/doom-loop-economy-work…
Stay Updated
Want to hear about our latest news and blogs?
Sign up now to get it straight to your inbox