Jobs and pay monitor - disabled workers
Since 2018, the TUC has been publishing an annual report on disability pay and employment gaps.
The first report, based on data from 2016/17[1], showed that:
- Non-disabled employees earnt 15.0 per cent more than disabled employees. We call this the disability pay gap.
- There was a 31.4 percentage point gap between the employment rates of disabled and non-disabled people. We refer to this gap as the disability employment gap.
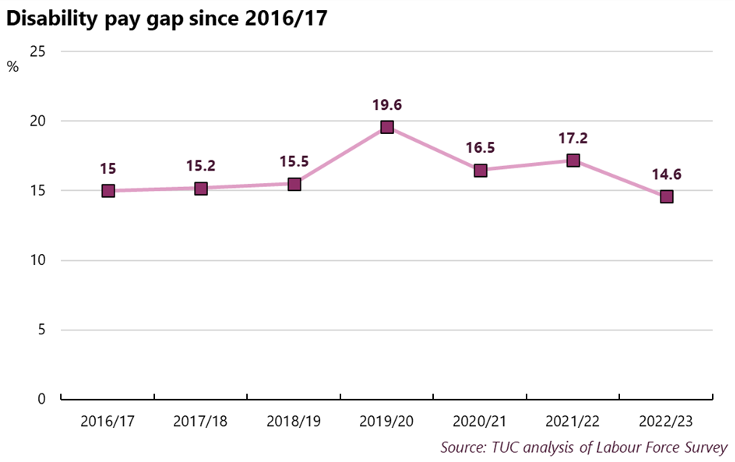
Our latest report, using data from 2022/23, shows little progress when it comes to pay. The disability pay gap stands at 14.6 per cent. This is a drop from last year, when the pay gap was 17.2 per cent, but little change compared to six years ago. The pay gap is higher than it was in 2013/14 (the earliest comparable data), when it was 13.2 per cent.
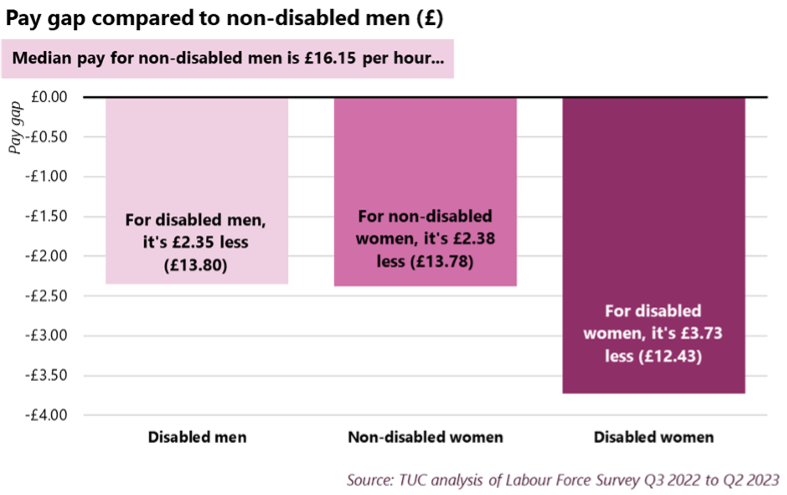
The disability pay gap intersects with the gender pay gap. Median hourly pay for non-disabled men is £3.73 higher (30 per cent) than it is for disabled women.
The employment gap now stands at 29.3 per cent. Up slightly on last year, but down by 2.1 percentage points since our first report, and by almost four percentage points since 2013. While the long-term trend is moving in the right direction, the recent widening of the gap is a concern.
As well as a lower rate of pay and a lower employment rate, disabled workers face an unemployment rate twice as high as what it is for non-disabled people. The unemployment rate for disabled workers is 6.7 per cent, compared to 3.3 for non-disabled workers.
This all means that disabled workers are less likely to have a paid job. And when they do, they earn substantially less than their non-disabled peers. Disabled people who are unable to work, or who are out of work, face a harsh benefits system. We want to see action to address disability pay and employment gaps, and a strengthening of the benefits system.
[1] Disability employment and pay gaps 2018, TUC (2018). Available at: https://www.tuc.org.uk/sites/default/files/Disabilityemploymentandpayga…
Methodology
Our labour market analysis is based on the Labour Force Survey Q3 2022 to Q2 2023 (referred to as 2022/23). This period is chosen as it makes use of the most recent data and allows for comparison with our previous analyses. When relevant, we refer to quarterly data.
Pay
The pay gap between disabled and non-disabled employees in 2022/23 is £1.90 per hour. This means that median hourly pay for non-disabled employees (£14.95) is 14.6 per cent more than it is for disabled employees (£13.05).
The pay gap has narrowed since 2021/22, when it was 17.2 per cent[2]. However, it remains only slightly below where it was in 2016/17 when the TUC first published its disability pay gap report (15.0 per cent). And it’s higher than it was in 2013/14, the first year of comparable data (13.2 per cent)[3].
[2] Jobs and pay monitor: disabled workers (Nov 2022), TUC (2022). Available at: https://www.tuc.org.uk/sites/default/files/2022-11/Jobs-and-pay-monitor…
[3] Disability employment and pay gaps 2018, TUC (2018). Available at: https://www.tuc.org.uk/sites/default/files/Disabilityemploymentandpayga…
Gender and disability
The disability pay gap intersects with the gender pay gap, with the pay gap being wider among disabled women and non-disabled men. Median hourly pay for disabled women (£12.43) is £3.73 less than it is for non-disabled men (£16.15). This shows how labour market inequalities do not exist in isolation, but instead often overlap.
Pay gaps by industry
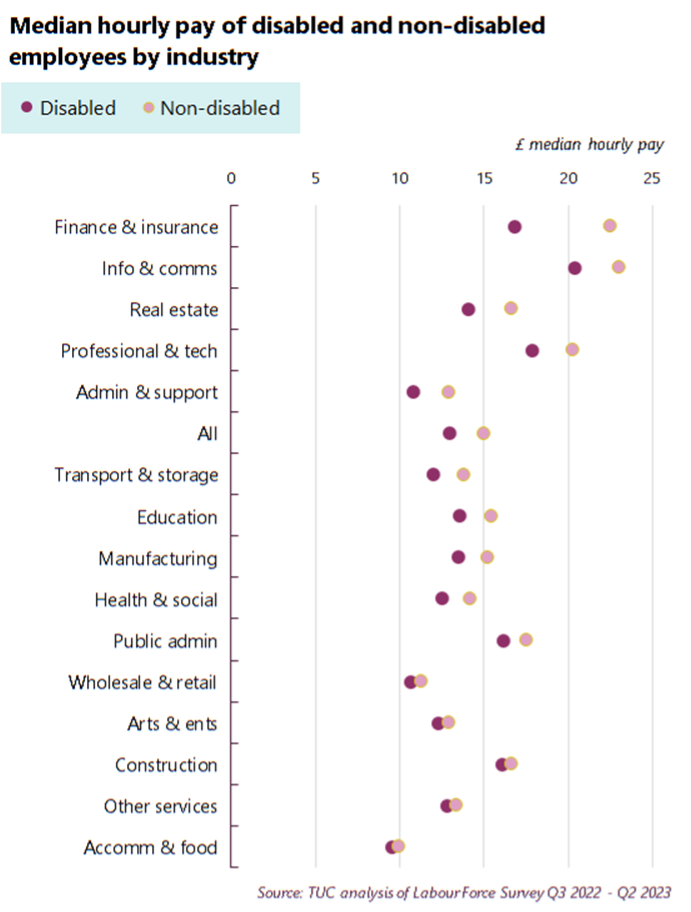
The pay gap also varies substantially by industry. The finance and insurance industry has, by a distance, the largest disability pay gap. Non-disabled employees in this industry are paid £5.60, or 33.2 per cent, more than disabled employees.
In cash terms, the disability pay gap in the finance industry is over double what it is in the industry with the second largest gap (information and communications and real estate both have pay gaps of £2.50). The industry with the second highest gap in percentage terms is admin and support services, where the gap is 19.4 per cent – almost fourteen percentage points lower.
The lowest pay gap is in the accommodation and food industry, which has a pay gap of £0.30 (or 3.1 per cent). Last year, this industry was the only one where disabled employees were paid more than non-disabled employees. This year, disabled employees are paid less than non-disabled employees in every industry.
Pay gap by age
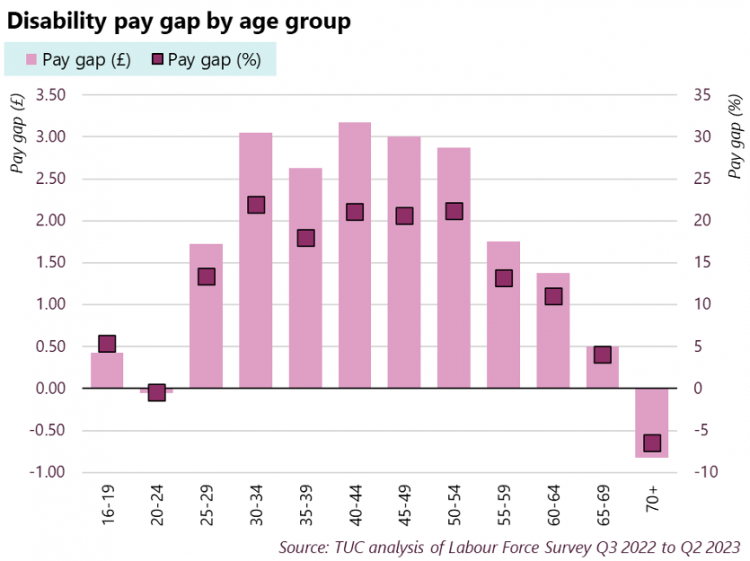
The disability pay gap is highest in percentage terms among 30-34 year olds (22 per cent) and is highest in cash terms among 40-44 year olds (£3.18). Median hourly pay for disabled employees is higher than it is for non-disabled employees in two age groups: 20-24 and 70+. Both are age groups where median pay itself is lower.
Pay gaps by region
Median hourly pay for non-disabled employees is higher than it is for disabled employees in every region of England, and in each country of the UK.
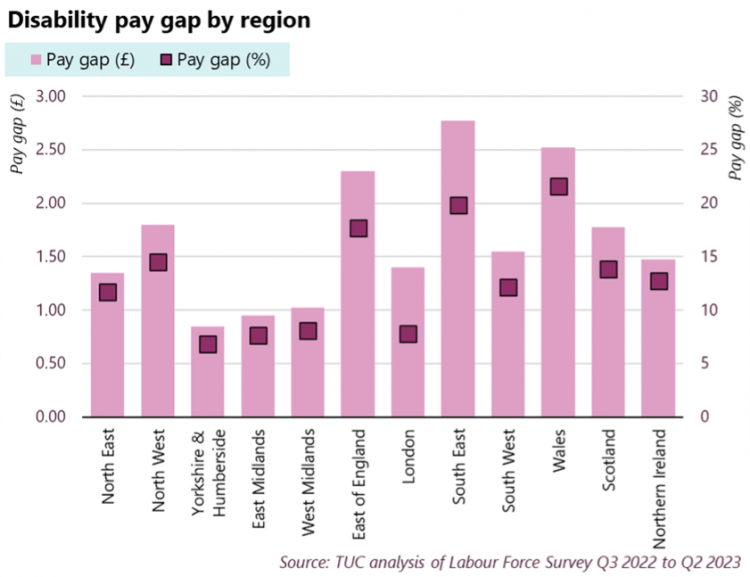
The gap is widest in cash terms in the South East (£2.78). In percentage terms, Wales has the widest gap (21.6 per cent). Given what we know about pay gaps by industry, one reason for the differences by region may be the industries that employees in the region are more likely to work in.
Employment
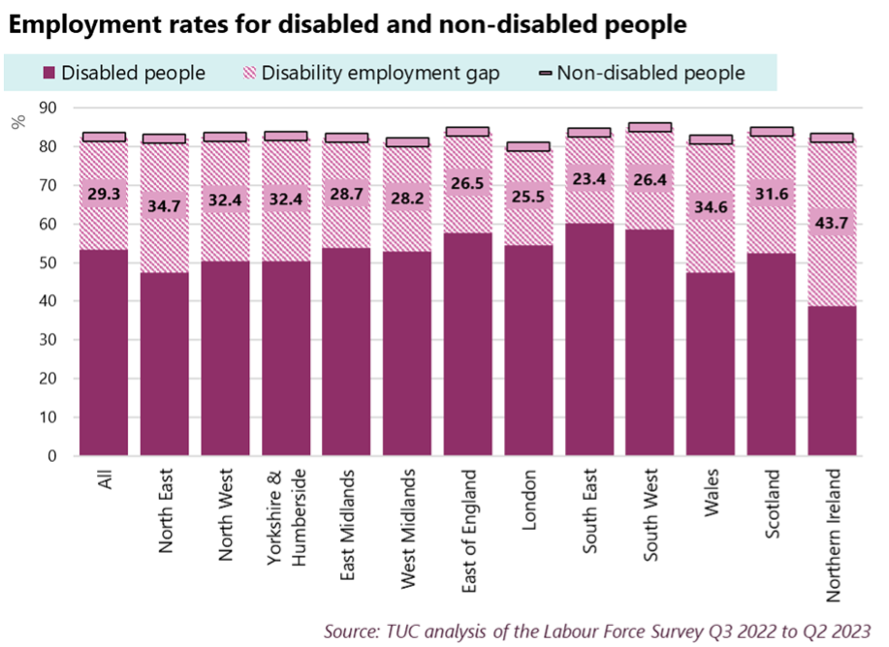
Employment gap
The employment gap is the percentage point gap between the employment rates of disabled and non-disabled people.
In 2022/23, the employment rate for disabled people was 53.3 per cent, compared to 82.6 per cent for non-disabled people. This gives an employment gap of 29.3 percentage points (ppts). The gap is wider than it was in 2021/22, when it was 28.5 ppts.
While the gap has widened over the past year, it remains just under four ppts lower now than it was ten years ago. In Q2 2013, the employment gap was 33.1 ppts. Analysis by the Department for Work and Pensions (DWP) shows that the main driver of the increase in disability employment since 2013 is disability prevalence, which it estimates accounts for 60 per cent of the increase[4]. This means that some of the rise in employment is due to more people who are already employed becoming disabled.
The disability employment gap varies across the UK, with the narrowest gap in the South East (23.4 ppts) and the widest in Northern Ireland (43.7 ppts).
Previous TUC analysis, as well as DWP analysis, has also shown that the employment rate for disabled people differs by health condition[5].
[4] ibid
[5] Employment of disabled people 2022, GOV.UK – DWP (2023). Available at: https://www.gov.uk/government/statistics/the-employment-of-disabled-peo…
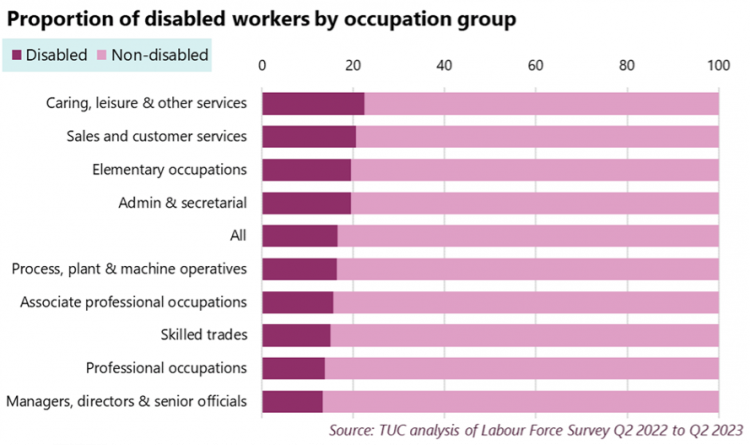
Disabled workers are more likely to be employed in low-paid occupations and more likely to be employed on a zero-hours contract
Disabled workers are more likely than non-disabled workers to be employed in low-paid occupations. As the chart below shows, 16 per cent of workers are disabled. There are, however, higher proportions of disabled people working in caring, leisure and other services (22 per cent), sales and customer services (21 per cent), elementary occupations (19 per cent) and admin and secretarial occupations (19 per cent). Disabled workers are underrepresented in managerial occupations (13 per cent) and professional occupations (14 per cent).
Disabled workers are overrepresented in:
- Caring, leisure and other services, where median hourly pay is £3.78 below the median across all employees (£12.05, compared to £15.83)[6]
- Sales and customer services, where median hourly pay is £4.59 below the median across all employees (£11.24)
- Elementary occupations, which is the lowest paid occupation, with median hourly pay of £11.08
- Admin and secretarial occupations, where median hourly pay is £2.41 lower than the median for all employees (£13.42)
Disabled workers are underrepresented in the highest paid occupations, especially managers, directors (£23.85 per hour) and senior officials and professional occupations (£23.30 per hour).
Disabled workers are also more likely than non-disabled workers to be employed on zero-hours contracts (4.5 per cent, compared to 3.4 per cent)[7].
A breakdown by ethnicity and gender shows that this gap is due to disabled white men being over twice as likely to be on a ZHC than non-disabled white men (4.7 per cent, compared to 2.2 per cent).
Disabled BME women are almost three times more likely than non-disabled white men to be employed on a ZHC (6.0 per cent), but it’s non-disabled BME women who are the most likely group to be employed on a ZHC (6.9 per cent).
Percentage of workers employed on a ZHC, by ethnicity and gender
|
|
Disabled |
Non-disabled |
|
White male |
4.7 |
2.2 |
|
White female |
4.1 |
3.9 |
|
BME male |
4.9 |
4.8 |
|
BME female |
6.0 |
6.9 |
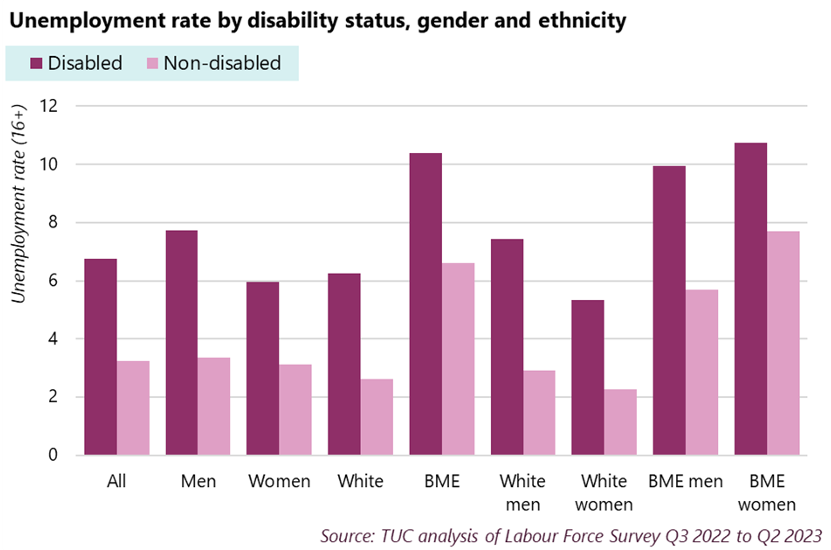
Unemployment
Disabled workers face a higher unemployment rate than non-disabled workers. In 2022/23, the unemployment rate for disabled workers is double what it is for non-disabled workers (6.7 per cent compared to 3.3 per cent)[8].
The higher unemployment rate for disabled workers intersects with another labour market inequality: the higher unemployment rate faced by Black and minority ethnic (BME) workers, especially BME women. Disabled BME workers face an unemployment rate almost four times higher than the unemployment rate for non-disabled white workers (10.4 per cent compared to 2.6 per cent), and it’s highest among disabled BME women (10.7 per cent).
[6] Pay data by occupation is taken from table 3 of the Annual Survey of Hours and Earnings (ASHE) 2023
[7] Data on zero-hours contracts is taken from Labour Force Survey Q2 2023.
[8] Someone is considered unemployed if they are without a job despite being “economically active”. A person is economically active if they are either in work or have been actively seeking work in the past four weeks and are available to start work in the next two weeks.
Economic inactivity
Not every person who is not employed is unemployed. Some people are “economically inactive”. Economic inactivity is defined as those who are not in employment, have not been seeking work within the last 4 weeks, and/or are unable to start work within the next 2 weeks. It includes, for example, people who are unable to work due to a disability or illness, students who are not working alongside their studies, and retirees. We sometimes refer to economic inactivity as “being out of the labour market”.
Disabled people have higher rates of economic inactivity than non-disabled people. The inactivity rate for disabled people is 42.7 per cent, compared to 14.5 per cent for non-disabled people. The rate is calculated as a percentage of all people aged 16-64.
The gap in inactivity rates is driven almost entirely by disabled workers being much more likely to be out of the labour market due to being disabled. 26 per cent of working-age disabled people are economically inactive due to long-term sickness or disability, which explains the vast majority of the 28 percentage point gap in inactivity rates between disabled and non-disabled people.
Disabled people are also more likely than non-disabled people to be out of the labour market due to caring responsibilities (6 per cent, compared to 3 per cent).
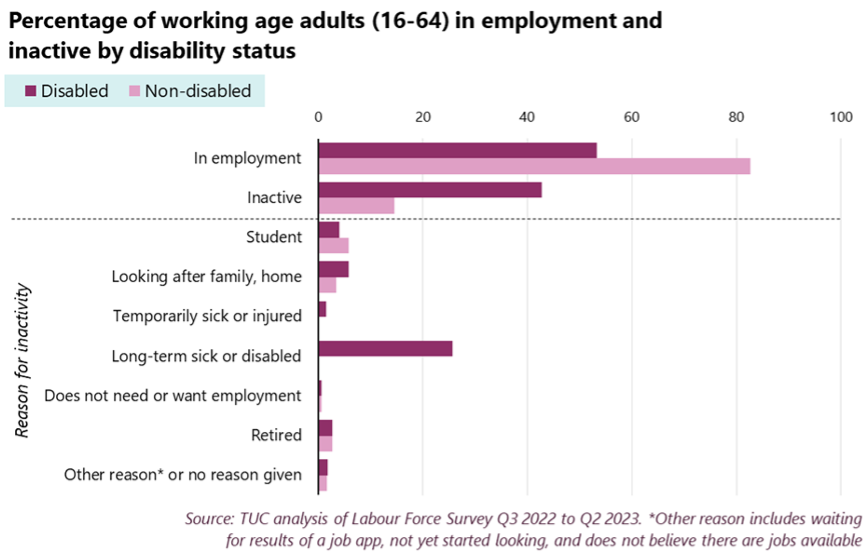
Disabled people who are out of the labour market are also more likely than non-disabled people out of the labour market to say they are not seeking work but would like a job (21 per cent of inactive disabled people say this, compared to 13 per cent of inactive non-disabled people).
Being more likely to be out of the labour market means that disabled people are more likely to be reliant on a benefits system that has intentionally been made harsher and crueller by the current government. The cuts in social security benefits since 2010 have disproportionately impacted disabled people. It’s important that the benefits system be made stronger and more generous for those who are unable to work and those who are out of work. The TUC has set out a plan for a fairer, more generous and more effective system.[9]
Why don’t the unemployment rate, employment rate and inactivity rate add up to 100 per cent?
You might have noticed that the unemployment rate, employment rate and inactivity rate do not add up to 100 per cent. This is because the unemployment rate is calculated in a different way to the employment rate and inactivity rate.
The employment rate is the number of employed people aged 16 to 64 as a percentage of the total number of people aged 16 to 64. The inactivity rate is calculated in the same way, but with the number of people who are economically inactive. This is in line with how the Office of National Statistics (ONS) calculates the employment and inactivity rate.
The unemployment rate, however, is the number of people aged 16 and over who are unemployed as a percentage of all of those who are economically active and aged 16 and over. This means it excludes those who are economically inactive (those who are out of work and not looking for work because they are, for example, disabled, a student, or caring for family members). Again, this is calculated in line with the ONS method.
Recommendations
Government
The government must bring in legislation to introduce mandatory disability pay gap reporting for all employers with more than 50 employees.
The legislation must be accompanied by a duty on employers to produce targeted action plans identifying the steps they will take to address any gaps identified, including ensuring disabled workers with hidden impairments feel confident in completing workplace equality monitoring.
The action plans employers produce must also identify and address intersectional issues for example how they intend to ensure, and gaps identifies for disabled women are addressed.
These action plans must be produced in consultation with recognised trade unions.
Employers
Employers should not wait for the government to bring in mandatory disability pay gap reporting and should take immediate steps to identify and address any gaps they have.
Employers should:
- collect and publish disability pay gap data in a similar manner to gender pay gap reporting, including the proportion of disabled people in each pay quarter
- collect data from disabled workers and job applicants in areas including:
- recruitment and promotion
- pay and remuneration
- training
- appraisals
- grievances
- disciplinary action
- dismissals and other reasons for leaving
- use this to inform targeted action plans
- set targets for improving disabled workers’ representation at all levels of their organisation
- measure and report progress against those targets annually
- work with trade unions to establish targets and develop positive action measures to address inequalities linked to disability within the workforce.
Where an employer has identified a disability pay gap or under-representation of disabled people, they should strongly consider using positive action as a way of addressing this for example within training and/or recruitment. This could include:
- hosting an open day specifically for disabled people to encourage them to get into a particular field.
- offering training or internships to help disabled workers get opportunities or progress at work.
Employers should consult with disabled staff and their trade unions on the best way to remove barriers and address the underlying causes of disability pay gaps, in recognising that disabled people themselves should be able to determine the solutions to the issues they face.
Improving the benefits system
While actions can be taken to help disabled people who want to work get into and stay work, some disabled people are unable to work. It’s therefore important to have a supportive welfare system to support people out of work.
We do not currently have this. The welfare system has been worsened by the introduction of Universal Credit. We believe that the policy and design of Universal Credit is fundamentally flawed and have set out a replacement for the system[10].
Data tables
Table 1. Disability pay gap over time
|
Year |
£ gap |
% gap |
|
2013/14 |
13.2 |
|
|
2016/17 |
15 |
|
|
2017/18 |
15.2 |
|
|
2018/19 |
1.65 |
15.5 |
|
2019/20 |
2.1 |
19.6 |
|
2020/21 |
1.9 |
16.5 |
|
2021/22 |
2.05 |
17.2 |
|
2022/23 |
1.9 |
14.6 |
Table 2. Median pay for disabled men, non-disabled women and disabled women compared to non-disabled men
|
|
Median hourly pay |
Difference compared to non-disabled men (£) |
Pay gap compared to non-disabled men, as % of own pay |
|
Non-disabled men |
16.15 |
0 |
|
|
Disabled men |
13.80 |
-2.35 |
17 |
|
Non-disabled women |
13.78 |
-2.38 |
17 |
|
Disabled women |
12.43 |
-3.73 |
30 |
Table 3. disability pay gap by industry
|
Industry |
Disabled |
Non-disabled |
£ gap |
% gap |
|
Finance & insurance |
16.85 |
22.45 |
5.60 |
33.2 |
|
Info & comms |
20.48 |
22.98 |
2.50 |
12.2 |
|
Real estate |
14.15 |
16.65 |
2.50 |
17.7 |
|
Professional & tech |
17.90 |
20.28 |
2.38 |
13.3 |
|
Admin & support |
10.83 |
12.93 |
2.10 |
19.4 |
|
All |
13.05 |
14.95 |
1.90 |
14.6 |
|
Transport & storage |
12.03 |
13.80 |
1.78 |
14.8 |
|
Education |
13.63 |
15.40 |
1.78 |
13.0 |
|
Manufacturing |
13.53 |
15.23 |
1.70 |
12.6 |
|
Health & social |
12.60 |
14.18 |
1.58 |
12.5 |
|
Public admin |
16.18 |
17.53 |
1.35 |
8.3 |
|
Water supply |
14.05 |
14.83 |
0.77 |
5.5 |
|
Wholesale & retail |
10.70 |
11.25 |
0.55 |
5.1 |
|
Arts & ents |
12.38 |
12.90 |
0.53 |
4.2 |
|
Construction |
16.10 |
16.60 |
0.50 |
3.1 |
|
Other services |
12.85 |
13.33 |
0.48 |
3.7 |
|
Accomm & food |
9.63 |
9.93 |
0.30 |
3.1 |
Table 4. Disability pay gap by age
|
|
Pay gap (£) |
Pay gap (%) |
|
16-19 |
0.43 |
5 |
|
20-24 |
-0.05 |
0 |
|
25-29 |
1.73 |
13 |
|
30-34 |
3.05 |
22 |
|
35-39 |
2.63 |
18 |
|
40-44 |
3.18 |
21 |
|
45-49 |
3.00 |
21 |
|
50-54 |
2.88 |
21 |
|
55-59 |
1.75 |
13 |
|
60-64 |
1.38 |
11 |
|
65-69 |
0.50 |
4 |
|
70+ |
-0.82 |
-6 |
Table 5. Disability pay gap by region
|
|
Pay gap (£) |
Pay gap (%) |
|
North East |
1.35 |
11.7 |
|
North West |
1.80 |
14.5 |
|
Yorkshire & Humberside |
0.85 |
6.8 |
|
East Midlands |
0.95 |
7.6 |
|
West Midlands |
1.03 |
8.1 |
|
East of England |
2.30 |
17.7 |
|
London |
1.40 |
7.8 |
|
South East |
2.78 |
19.8 |
|
South West |
1.55 |
12.1 |
|
Wales |
2.53 |
21.6 |
|
Scotland |
1.78 |
13.8 |
|
Northern Ireland |
1.48 |
12.8 |
Table 6. Employment rates for disabled and non-disabled people, by region
|
|
Disabled people |
Non-disabled people |
Disability employment gap |
|
All |
53.3 |
82.6 |
29.3 |
|
North East |
47.4 |
82.1 |
34.7 |
|
North West |
50.3 |
82.6 |
32.4 |
|
Yorkshire & Humberside |
50.4 |
82.8 |
32.4 |
|
East Midlands |
53.8 |
82.4 |
28.7 |
|
West Midlands |
52.9 |
81.1 |
28.2 |
|
East of England |
57.6 |
84.0 |
26.5 |
|
London |
54.5 |
80.1 |
25.5 |
|
South East |
60.2 |
83.7 |
23.4 |
|
South West |
58.6 |
85.0 |
26.4 |
|
Wales |
47.3 |
81.9 |
34.6 |
|
Scotland |
52.3 |
83.9 |
31.6 |
|
Northern Ireland |
38.6 |
82.4 |
43.7 |
Table 7. Proportion of disabled workers by occupation group
|
|
Disabled (%) |
Non-disabled (%) |
|
Caring, leisure & other services |
22 |
78 |
|
Sales and customer services |
21 |
79 |
|
Elementary occupations |
19 |
81 |
|
Admin & secretarial |
19 |
81 |
|
All |
16 |
84 |
|
Process, plant & machine operatives |
16 |
84 |
|
Associate professional occupations |
16 |
84 |
|
Skilled trades |
15 |
85 |
|
Professional occupations |
14 |
86 |
|
Managers, directors & senior officials |
13 |
87 |
Table 8. Unemployment rates by disability status, gender and ethnicity
|
|
Disabled |
Non-disabled |
|
All |
6.7 |
3.3 |
|
Men |
7.7 |
3.4 |
|
Women |
6.0 |
3.1 |
|
White |
6.3 |
2.6 |
|
BME |
10.4 |
6.6 |
|
White men |
7.4 |
2.9 |
|
White women |
5.3 |
2.3 |
|
BME men |
9.9 |
5.7 |
|
BME women |
10.7 |
7.7 |
Table 9. Percentage of working-age adults in employment and inactive by disability status, with a breakdown by reason for inactivity
|
|
Disabled |
Non-disabled |
All |
|
Total working age adults |
100 |
100 |
100 |
|
In employment |
53.3 |
82.6 |
75.9 |
|
Inactive |
43 |
15 |
21 |
|
Waiting for results of job app |
0 |
0 |
0 |
|
Student |
4 |
6 |
5 |
|
Looking after family, home |
6 |
3 |
4 |
|
Temporarily sick or injured |
1 |
0 |
0 |
|
Long-term sick or disabled |
26 |
0 |
6 |
|
Believes no jobs available |
0 |
0 |
0 |
|
Not yet started looking |
0 |
0 |
0 |
|
Does not need or want employment |
1 |
1 |
1 |
|
Retired |
3 |
3 |
3 |
|
Other reason |
1 |
1 |
1 |
|
Other reason* or no reason given |
2 |
2 |
2 |
|
No reason given |
0 |
0 |
0 |
[9] UC is “not fit for purpose”: TUC calls for a new benefit “to deliver a fair and dignified system for everyone”, Disability Rights UK (2022). Available at: https://www.disabilityrightsuk.org/news/uc-%E2%80%9Cnot-fit-purpose%E2%…
[10] A replacement for Universal Credit, TUC (2022). Available at: https://www.tuc.org.uk/research-analysis/reports/replacement-universal-credit
Stay Updated
Want to hear about our latest news and blogs?
Sign up now to get it straight to your inbox