TUC Equality Audit 2018
The data shows that women are better represented in union membership than men, white employees are better represented than BME employees and older workers are better represented than young workers. Disabled employees are better represented among union members than are non-disabled employees.
As was the case in 2014, there are no reliable official statistics on the size of the LGBT+ workforce, so accurate assessments of trade union representation are not possible.
Women
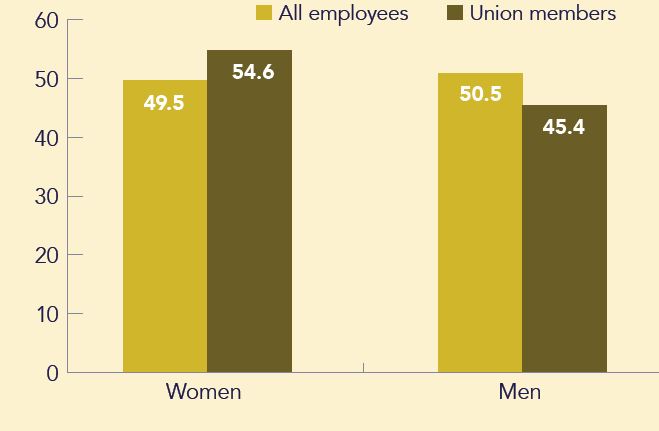
Women make up 49.5 per cent of UK employees. Since 2002, union density has been higher among female employees than male employees and in 2017 it was 25.6 per cent compared with 20.9 per cent for men. As Chart 1 shows, in 2017, 54.6 per cent of union members were women, despite accounting for just 49.5 per cent of employees.
Chart 1: Representation of women in union membership (%)
In part these trends reflect higher female employment rates in the public sector. UK union density is much higher in the public sector, where 51.8 per cent of employees are union members, than it is in the private sector, where the figure is only 13.5 per cent.
Trade union density among women is highest for those in professional occupations. Fifty- three per cent of women in professional occupations are union members compared with 29 per cent of men. Teachers, midwives and nurses are female-dominated professions that are highly unionised, which contributes to the high proportion of female union members.
Some women are under-represented as union members.
Women are more likely than men to work part-time (73 per cent of part-time workers are women 2 ) and part-time workers are under- represented in trade unions. Those working part-time form 25.7 per cent of employees but just 21.5 per cent of union members.
Just one in seven (14.5 per cent) women in temporary jobs are union members. Although this is higher than for men in temporary jobs, 11.6 per cent of whom are union members, it is still well below the 25.6 per cent of women who are union members overall.
While 24.7 per cent of women in caring, leisure and other service occupations are union members, this is the case for just 14.2 per cent of women in sales and customer service jobs and 11.7 per cent of women in ‘elementary occupations’.
BME workers
BME employees are under-represented in union membership. While they account for 11.7 of all employees, they make up just nine percent of union members. This is the case for employees from all groups other than white.While 5.6 per cent of all employees identify as Asian or Asian British, this group accounts for only 4.3 per cent of union members. Black or Black British people constitute 2.9 per cent of employees and 2.8 per cent of union members. Those identifying as Chinese or from another ethnic group form 2.1 per cent of the employee population but just one per cent of union members.
Employees from a mixed ethnic background are more likely to be union members than they were four years ago (20.4 per cent compared with 17.1 per cent) but, as they form only a small proportion of employees, this has not had much effect on overall union density. Density among Black or Black British employees has fallen substantially (to 24.1 per cent compared with 29.3 per cent), as has density among Chinese and other ethnic group employees (to 11.5 per cent from 17.6 per cent).
Across all non-white groups, women are more likely to be trade union members than men. However, union density has fallen for each group of women other than mixed race women compared with four years ago.
As the recent government Race Disparity Audit 3 showed, employment rates are higher for white workers than for Black workers. TUC analysis has shown that Black workers are far more likely than white counterparts to be in insecure jobs, with those in temporary work less likely to be in unions.4
Disabled workers
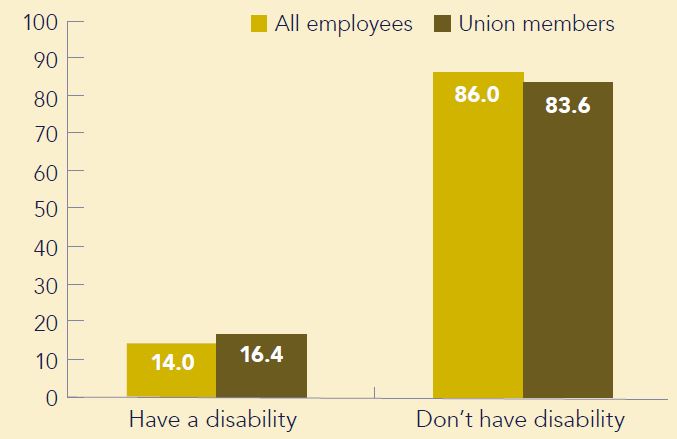
According to the Labour Force Survey, disabled employees are more likely to be union members than non-disabled employees – 16.4 per cent of union members in 2017 were disabled compared to 14 per cent of all employees, as Chart 2 shows. To some extent,this may reflect the higher chance of people becoming disabled as they age, and the higher average age of trade union members, as well as the higher employment rates of disabled people in the public sector (discussed in further detail below).
Chart 2: Representation of disabled workers in union membership (%)
The TUC report Disability Employment and Pay Gaps 5 . shows that disabled people have significantly lower employment rates than non-disabled people, and for some disabled people employment rates are as low as 20 per cent. Disabled people are more likely to be in part-time jobs and lower-paid occupations, and it is likely that these workers are under-represented as union members.
LGBT+ workers
The Annual Population Survey (APS) published by the Office for National Statistics found that two per cent of people older than 16 in the UK identified as lesbian, gay or bisexual in 2016.6
However, there are no reliable official statistics on the size of the LGBT+ workforce.
Young workers
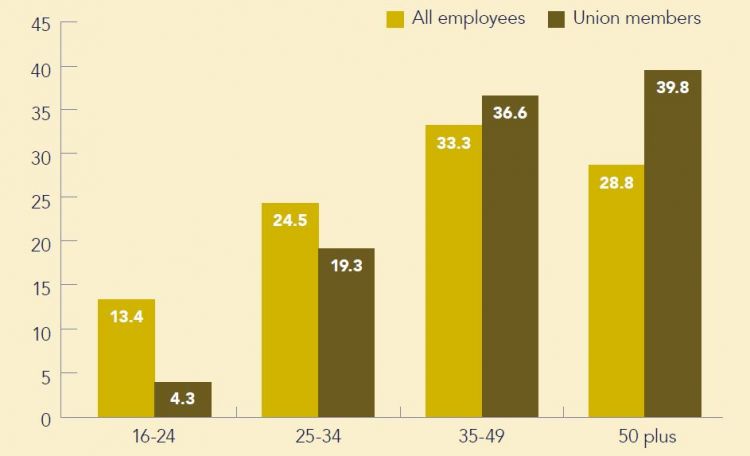
There is a large gap in union density between young workers and older workers. Older groups are over-represented in union
membership – just 29 per cent of all employees are aged 50 plus whereas 40 per cent of union members are. Only four per cent of union members are aged under 25 compared to 13 per cent of employees.
As a recent TUC report 7 showed, young workers face major barriers in the workplace, with too many concentrated in low-paid jobs with a lack of access to skills development at work and no workplace voice. The need for increased trade union membership among this group is clear.
Chart 3: Representation of different age groups in union membership (%)
- 5 https://www.tuc.org.uk/research-analysis/reports/disability-employment-…
- 6 “Sexual Identity, UK 2016: Experimental official statistics on sexual identity in the UK in 2016 by region, sex, age, marital status, ethnicity and National Statistics Socio-economic Classification” ONS, 2016
- 7 https://www.tuc.org.uk/sites/default/files/Stuck%20at%20the%20start-%20…
Stay Updated
Want to hear about our latest news and blogs?
Sign up now to get it straight to your inbox