A £10 minimum wage would benefit millions of key workers
Introduction
During the current pandemic, there are millions of key workers keeping the country running. These include, among many other occupations, doctors, nurses, carers, hospital porters, teachers and shopworkers.
However, despite the essential work that key workers do, many are underpaid. The TUC has been calling for the minimum wage to be increased to £10 per hour to ensure that everyone is paid enough to get by.
Unfortunately, we estimate that 38 per cent of key workers are being paid less than £10 per hour. This is higher than the percentage among employees who aren’t key workers (31 per cent).
We believe that the national minimum wage should be increased as soon as possible. This will not only benefit key workers, but all of those currently being paid less than £10 per hour.
In this brief research note, we set out an estimate for the number of key workers, as well as the number of key workers earning below £10 per hour. We look at the proportion of key workers by region, gender, ethnicity, age, and public/private sector.
We show that a rise in the minimum wage to £10 per hour would mean a pay increase for up to 3.7 million key workers. As well as this, due to the demographics of those working in key worker occupations, this would particularly help female key workers, as well as young key workers.
How many key workers are there?
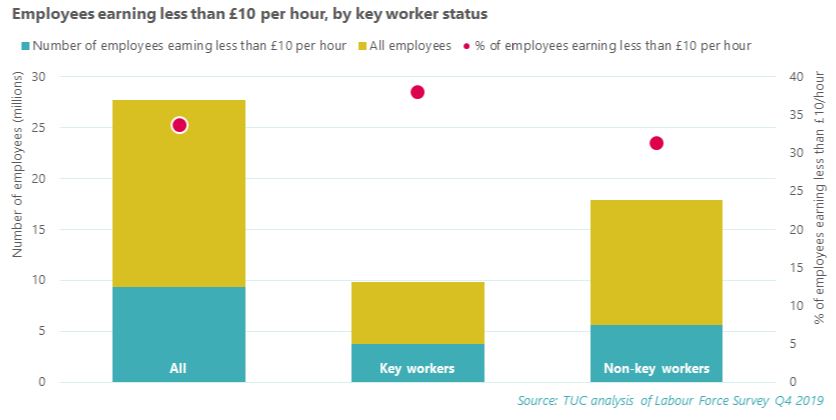
We estimate that there are up to 9.8 million employees who, in line with government guidance, could be classified as a key worker. This is around 35 per cent of all employees. 3.7 million of these earn less than £10 per hour.
This means that 38 per cent of key workers would benefit from the national minimum wage being increased to £10 per hour. This is a higher rate than we see among employees who aren’t key workers (31 per cent).
Who counts as a key worker?
The government’s guidance on who is a key worker is vague, and therefore our estimates rely on our interpretation.
To reach an estimate, we matched occupation groups, broken down to four-digit occupation codes, to the government’s guidance on key workers. We then used the Labour Force Survey to find the number of employees in these key worker occupation groups, as well as the number of employees earning less than £10 per hour and further information about who is working in these occupations (such as gender, age, and ethnicity breakdowns).
Even at the detail level of four-digit occupation codes however, we cannot guarantee that everyone within every occupation is a key worker.
The appendix contains the background tables, as well as a list of occupations we think fall within the key worker guidance, alongside the section of guidance they fell under.
Regional key worker employment
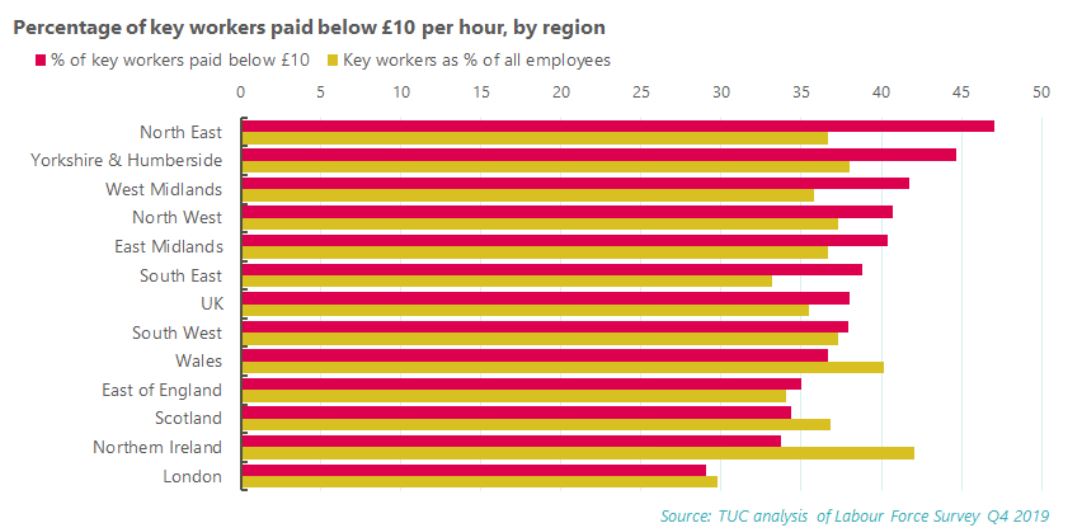
Key workers make up 35 per cent of all employees, but this varies by region. London has the lowest proportion (30 per cent), whereas Northern Ireland has the highest (42 per cent).
There are also significant regional disparities in the percentage of key workers who earn less than £10 per hour. In the North East, almost half of all key workers (47 per cent) are being paid less than £10 per hour. The proportion is also over 40 per cent in Yorkshire and Humberside, the West Midlands and the North West. London has the lowest proportion, but it’s still as high as 29 per cent.
Gender differences
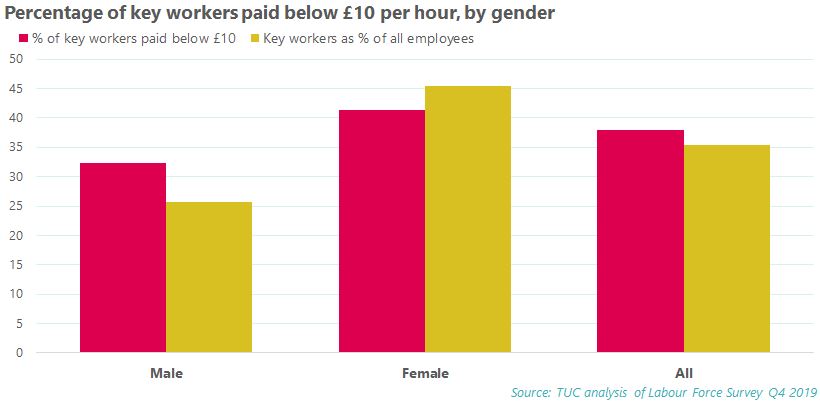
Women are almost twice as likely as men to be employed in a key worker occupation (45 per cent, compared to 26 per cent). Many of the largest key worker occupations have a large majority of female employees. Care workers and home carers, nurses, primary and nursery education teaching professionals and teaching assistants, for example, are some of the largest key worker occupations. In each, over 80 per cent of employees are women.
As well as being more likely to be key workers, women are more likely to be low paid once they are within the key worker status. 41 per cent of female key workers are paid less than £10 per hour, compared to 32 per cent of male key workers.
Age
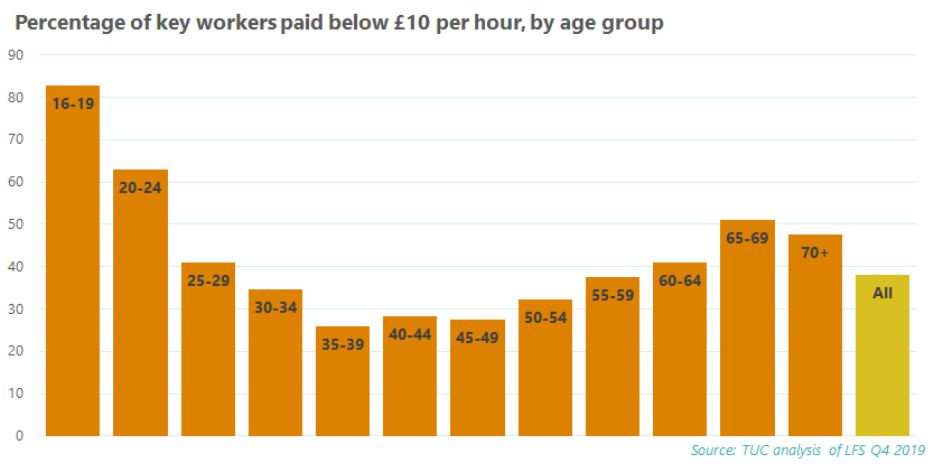
The percentage of employees who are key workers is fairly consistent across all age groups, all falling within a few percentage points of the proportion of all employees (35 per cent).
However, there’s a wide disparity between the percentage of key workers in each age group that earn less than £10 per hour. Young key workers are the most likely to be earning less than £10 per hour. 83 per cent of key workers aged 16 to 19 are paid less than £10 per hour. Among those aged 20 to 24, almost two-thirds of key workers (63 per cent) earn less than £10 per hour. This may relate to the fact that the national minimum wage for those aged 16-17 is just £4.55.
National Minimum Wage rates
|
Age |
16-17 |
18-20 |
21-24 |
25 and over |
|
Rate |
£4.15 |
£4.55 |
£6.45 |
£8.72 |
But it’s not just the majority of young key workers who would benefit from increasing the national minimum wage to £10 per hour. Among key workers aged 65 to 69, 51 per cent are paid less than £10 per hour.
Ethnicity
Black and minority ethnic (BME) employees are more likely than white employees to be key workers, with 40 per cent of BME employees being a key worker, compared to 35 per cent of white key workers.While BME employees are more likely to be key workers, there’s no significant difference in the percentage of key workers being paid less than £10 per hour (39 per cent of BME key workers, compared to 38 per cent of white key workers).
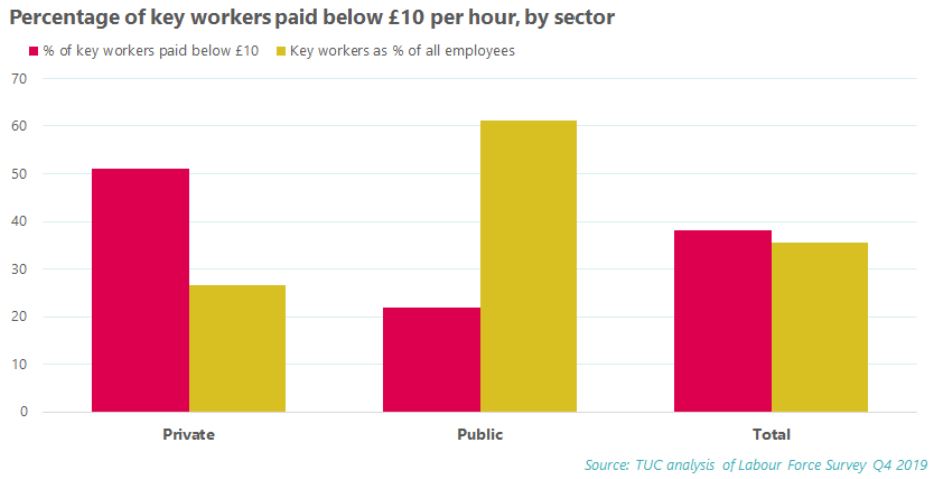
Public/private sector
While public sector employees are much more likely than private sector employees to be key workers, private sector key workers are much more likely to be paid less than £10 per hour.
Despite making up 26 per cent of all employees, public sector employees make up 52 per cent of key workers. 6-in-10 public sector employees are key workers, compared to around a quarter of private sector employees.
However, the majority (51 per cent) of private sector key workers are paid below £10, compared to 22 per cent of public sector key workers.
This reflects that many key worker occupations are in the public sector, and some of these occupations have relatively high pay, such as doctors and teachers. Union density is also significantly higher in the public sector. In contrast, there are a number of key worker occupations with both a high number of private sector employees and a high percentage of employees earning less than £10 per hour. These include shop workers, carers, and pharmacy and dispensing assistants.

Recommendations
We need a £10 minimum wage now. This would mean a pay rise for around 9 million employees. This includes the 3.7 million key workers who are currently being paid less than this while doing vital work to keep the country running.
A rise in the minimum wage would particularly benefit female key workers and young key workers, as well as key workers in the private sector and those working in northern regions and the midlands.
This ask is part of our five ways to thank a worker this May Day. In recognition of the contribution of key workers during this period, the TUC is calling on government to:
- Increase the minimum wage to £10 an hour for everyone now.
- Deliver fair pay rises for our key workers and rewards for workers across the economy that restore what they've lost through ten years of cuts and slow growth.
- Ban zero-hours contracts and stamp out false self-employment
- Increase sick pay to the real living wage and make sure everyone can get it from day one.
- Bring outsourced workers like cleaners in the NHS back into the public sector on public sector terms and conditions
Appendix
Background tables
|
All employees |
||||||
|
Employees |
Employees paid below £10 per hour |
% of employees earning less than £10 per hour |
||||
|
All |
27,743,698 |
9,361,640 |
34 |
|||
|
Key workers |
9,839,175 |
3,742,257 |
38 |
|||
|
Non-key workers |
17,904,523 |
5,619,383 |
31 |
|||
|
Regions |
||||||
|
All employees |
Employees earning less than £10 per hour |
Key workers |
Key workers paid below £10 |
% of key workers paid below £10 |
Key workers as % of all employees |
|
|
North East |
1,053,188 |
472,463 |
386,595 |
182,050 |
47 |
37 |
|
North West |
3,068,221 |
1,140,943 |
1,145,114 |
465,995 |
41 |
37 |
|
Yorkshire and Humberside |
2,196,641 |
875,896 |
834,481 |
372,782 |
45 |
38 |
|
East Midlands |
2,045,904 |
792,088 |
749,432 |
302,969 |
40 |
37 |
|
West Midlands |
2,434,228 |
967,515 |
871,257 |
363,878 |
42 |
36 |
|
East of England |
2,619,757 |
838,026 |
892,433 |
312,245 |
35 |
34 |
|
London |
3,807,241 |
823,063 |
1,133,458 |
329,437 |
29 |
30 |
|
South East |
3,867,041 |
1,135,727 |
1,284,188 |
498,548 |
39 |
33 |
|
South West |
2,327,124 |
852,448 |
868,782 |
329,693 |
38 |
37 |
|
Wales |
1,270,830 |
456,354 |
510,506 |
187,281 |
37 |
40 |
|
Scotland |
2,324,819 |
718,269 |
856,468 |
294,033 |
34 |
37 |
|
Northern Ireland |
728,704 |
288,848 |
306,461 |
103,346 |
34 |
42 |
|
Total |
27,743,698 |
9,361,640 |
9,839,175 |
3,742,257 |
38 |
35 |
|
Age |
||||||
|
All employees |
Employees earning less than £10 per hour |
Key workers |
Key workers paid below £10 |
% of key workers paid below £10 |
Key workers as % of all employees |
|
|
16-19yrs |
993,752 |
848,878 |
365,388 |
302,093 |
83 |
37 |
|
20-24yrs |
2,585,468 |
1,588,946 |
865,086 |
544,521 |
63 |
33 |
|
25-29yrs |
3,418,015 |
1,151,574 |
1,142,959 |
467,602 |
41 |
33 |
|
30-34yrs |
3,332,097 |
920,494 |
1,159,337 |
400,740 |
35 |
35 |
|
35-39yrs |
3,220,732 |
732,035 |
1,110,566 |
286,990 |
26 |
34 |
|
40-44yrs |
2,885,512 |
690,960 |
996,302 |
280,801 |
28 |
35 |
|
45-49yrs |
3,048,923 |
736,786 |
1,115,069 |
306,960 |
28 |
37 |
|
50-54yrs |
3,164,008 |
877,082 |
1,163,569 |
373,977 |
32 |
37 |
|
55-59yrs |
2,693,372 |
875,636 |
1,018,506 |
383,308 |
38 |
38 |
|
60-64yrs |
1,609,788 |
543,076 |
618,204 |
253,096 |
41 |
38 |
|
65-69yrs |
549,171 |
279,332 |
205,449 |
104,729 |
51 |
37 |
|
70 and overs |
242,860 |
116,841 |
78,740 |
37,440 |
48 |
32 |
|
Total |
27,743,698 |
9,361,640 |
9,839,175 |
3,742,257 |
38 |
35 |
|
Gender |
||||||
|
All employees |
Employees paid below £10 per hour |
Key workers |
Key workers paid below £10 |
% of key workers paid below £10 |
Key workers as % of all employees |
|
|
Male |
13,935,349 |
3,823,471 |
3,572,654 |
1,155,611 |
32 |
26 |
|
Female |
13,808,349 |
5,538,169 |
6,266,521 |
2,586,646 |
41 |
45 |
|
Total |
27,743,698 |
9,361,640 |
9,839,175 |
3,742,257 |
38 |
35 |
|
Ethnicity |
||||||
|
All employees |
Employees paid below £10 per hour |
Key workers |
Key workers paid below £10 |
% of key workers paid below £10 |
Key workers as % of all employees |
|
|
White |
24,417,345 |
8,283,406 |
8,501,511 |
3,218,700 |
38 |
35 |
|
BME |
3,319,388 |
1,078,234 |
1,335,670 |
523,557 |
39 |
40 |
|
Total |
27,736,733 |
9,361,640 |
9,837,181 |
3,742,257 |
38 |
35 |
|
Public/private sector |
||||||
|
All employees |
Employees paid below £10 per hour |
Key workers |
Key workers paid below £10 |
% of key workers paid below £10 |
Key workers as % of all employees |
|
|
Private |
20,499,929 |
7,652,175 |
5,437,225 |
2,773,953 |
51 |
27 |
|
Public |
7,169,217 |
1,696,081 |
4,382,891 |
963,124 |
22 |
61 |
|
Total |
27,669,146 |
9,348,256 |
9,820,116 |
3,737,077 |
38 |
35 |
List of key worker occupations
Our list of key worker occupations is based on matching four-digit occupation codes to the key worker guidance.
As explained above, this is an interpretation and an estimate. Even at four-digit occupation level, occupations do not perfectly match the government’s guidance on key workers, which is vague at times.
|
Code |
Employees |
Link to key worker guidance |
|
|
Elected officers and representatives |
1116 |
11,537 |
Local and national government |
|
Mngrs and directors in transport and distribution |
1161 |
87,173 |
Transport |
|
Mngrs and directors in storage and warehousing |
1162 |
112,206 |
Food distribution |
|
Officers in armed forces |
1171 |
27,866 |
Armed forces personnel |
|
Snr police officers |
1172 |
8,537 |
Police |
|
Snr offcrs in fire, amblnc, prison and related srvcs |
1173 |
10,925 |
Public safety and national security |
|
Health servcs and public health mngrs and directors |
1181 |
71,576 |
Health and social care |
|
Social servcs mngrs and directors |
1184 |
34,527 |
Social workers |
|
Mngrs and directors in retail and wholesale |
1190 |
281,478 |
Food distribution |
|
Healthcare practice mngrs |
1241 |
17,515 |
Healthcare |
|
Residential, day and domic care mngrs and prprtrs |
1242 |
63,486 |
Social care |
|
Shopkeepers and Prprtrs ? wholesale and retail |
1254 |
25,349 |
Food distribution |
|
Waste disposal and environmental services mngrs |
1255 |
12,377 |
Utilities |
|
Medical practitioners |
2211 |
247,847 |
Healthcare |
|
Psychologists |
2212 |
27,900 |
Healthcare |
|
Pharmacists |
2213 |
63,468 |
Producers and distributors of medicine |
|
Ophthalmic opticians |
2214 |
10,440 |
Healthcare |
|
Dental practitioners |
2215 |
9,460 |
Healthcare |
|
Veterinarians |
2216 |
19,864 |
Vet medicine |
|
Medical radiographers |
2217 |
40,132 |
Healthcare |
|
Podiatrists |
2218 |
1,921 |
Healthcare |
|
Health professionals n.e.c. |
2219 |
56,780 |
Healthcare |
|
Physiotherapists |
2221 |
72,432 |
Healthcare |
|
Occupational therapists |
2222 |
45,938 |
Healthcare |
|
Speech and language therapists |
2223 |
16,355 |
Healthcare |
|
Therapy professionals n.e.c. |
2229 |
22,941 |
Healthcare |
|
Nurses |
2231 |
699,542 |
Healthcare |
|
Midwives |
2232 |
44,672 |
Healthcare |
|
Secondary education teaching professionals |
2314 |
403,871 |
Teaching staff |
|
Primary and nursery education teaching professionals |
2315 |
480,252 |
Teaching staff |
|
Special needs education teaching professionals |
2316 |
75,786 |
Teaching staff |
|
Snr professionals of educational establishments |
2317 |
103,759 |
Teaching staff |
|
Teaching and other educational professionals n.e.c. |
2319 |
138,753 |
Teaching staff |
|
Barristers and judges |
2412 |
7,548 |
Justice system workers |
|
Solicitors |
2413 |
96,230 |
Justice system workers |
|
Social workers |
2442 |
111,341 |
Health and social care |
|
Probation officers |
2443 |
14,763 |
Prison and probation staff |
|
Clergy |
2444 |
29,370 |
Religious staff |
|
Paramedics |
3213 |
32,554 |
Healthcare |
|
Dispensing opticians |
3216 |
9,088 |
Healthcare |
|
Pharmaceutical technicians |
3217 |
31,292 |
Healthcare |
|
Medical and dental technicians |
3218 |
35,327 |
Healthcare |
|
Health associate professionals n.e.c. |
3219 |
24,038 |
Healthcare |
|
Child and early years officers |
3233 |
41,548 |
Childcare |
|
Housing officers |
3234 |
61,528 |
Admin delivering essential public services |
|
Counsellors |
3235 |
24,331 |
Healthcare |
|
Welfare and housing associate professionals n.e.c. |
3239 |
141,931 |
Admin delivering essential public services |
|
NCOs and other ranks |
3311 |
48,126 |
Armed forces personnel |
|
Police officers (sergeant and below) |
3312 |
169,129 |
Police |
|
Fire service officers (watch manager and below) |
3313 |
47,748 |
Fire and rescure |
|
Prison service officers (below principal officer) |
3314 |
42,561 |
Prison and probation staff |
|
Police community support officers |
3315 |
9,294 |
Police |
|
Protective service associate professionals n.e.c. |
3319 |
64,568 |
Armed forces personnel |
|
Air traffic controllers |
3511 |
2,770 |
Air transport |
|
Aircraft pilots and flight engineers |
3512 |
21,867 |
Air transport |
|
Ship and hovercraft officers |
3513 |
17,312 |
Water transport |
|
Public services associate professionals |
3561 |
98,786 |
Local and national government |
|
National government administrative occupations |
4112 |
148,235 |
Local and national government |
|
Local government administrative occupations |
4113 |
139,543 |
Local and national government |
|
Bank and post office clerks |
4123 |
84,645 |
Workers in banks and post |
|
Transport and distribution clerks and assistants |
4134 |
64,549 |
Transport |
|
Medical secretaries |
4211 |
62,447 |
Healthcare |
|
School secretaries |
4213 |
67,840 |
Education |
|
Farmers |
5111 |
19,957 |
Food production |
|
Telecommunications engineers |
5242 |
54,521 |
Telecommunications |
|
Butchers |
5431 |
24,661 |
Food production/distributon |
|
Bakers and flour confectioners |
5432 |
23,291 |
Food production/distributon |
|
Fishmongers and poultry dressers |
5433 |
9,581 |
Food production/distributon |
|
Nursery nurses and assistants |
6121 |
207,410 |
Childcare |
|
Childminders and related occupations |
6122 |
36,661 |
Childcare |
|
Playworkers |
6123 |
24,004 |
Childcare |
|
Teaching assistants |
6125 |
298,302 |
Education |
|
Educational support assistants |
6126 |
172,439 |
Education |
|
Veterinary nurses |
6131 |
23,354 |
Vetinary services |
|
Nursing auxiliaries and assistants |
6141 |
389,929 |
Healthcare |
|
Ambulance staff (excluding paramedics) |
6142 |
29,886 |
Healthcare |
|
Dental nurses |
6143 |
46,089 |
Healthcare |
|
Houseparents and residential wardens |
6144 |
37,673 |
Social care |
|
Care workers and home carers |
6145 |
742,294 |
Social care |
|
Senior care workers |
6146 |
83,331 |
Social care |
|
Care escorts |
6147 |
5,384 |
Social care |
|
Undertakers, mortuary and crematorium assistants |
6148 |
25,464 |
Management of the deceased |
|
Air travel assistants |
6214 |
65,395 |
Air transport |
|
Rail travel assistants |
6215 |
16,309 |
Rail transport |
|
Sales and retail assistants |
7111 |
1,016,953 |
Food distribution |
|
Retail cashiers and check-out operators |
7112 |
159,710 |
Food distribution |
|
Pharmacy and other dispensing assistants |
7114 |
78,980 |
Healthcare |
|
Communication operators |
7214 |
24,107 |
Handle emergency calls |
|
Food, drink and tobacco process operatives |
8111 |
139,914 |
Food production |
|
Energy plant operatives |
8124 |
4,761 |
Utilities |
|
Water and sewerage plant operatives |
8126 |
9,953 |
Utilities |
|
Road construction operatives |
8142 |
15,393 |
Road transport |
|
Rail construction and maintenance operatives |
8143 |
10,320 |
Road transport |
|
Large goods vehicle drivers |
8211 |
284,017 |
Retail distribution |
|
Bus and coach drivers |
8213 |
109,819 |
Road transport |
|
Train and tram drivers |
8231 |
29,898 |
Rail transport |
|
Marine and waterways transport operatives |
8232 |
6,477 |
Water transport |
|
Air transport operatives |
8233 |
15,329 |
Air transport |
|
Rail transport operatives |
8234 |
19,190 |
Rail transport |
|
Farm workers |
9111 |
36,044 |
Food production |
|
Fishing and other elementary agriculture occs n.e.c. |
9119 |
11,310 |
Food production |
|
Packers, bottlers, canners and fillers |
9134 |
123,484 |
Food production |
|
Postal workers, mail sorters, mssngrs and couriers |
9211 |
153,083 |
Postal services |
|
Refuse and salvage occupations |
9235 |
27,041 |
Waste disposal |
|
Parking and civil enforcement occupations |
9242 |
16,586 |
Local and national government |
|
Shelf fillers |
9251 |
72,972 |
Food distribution |
|
Elementary sales occupations n.e.c. |
9259 |
22,225 |
Food distribution |
|
Hospital porters |
9271 |
18,700 |
Healthcare |
|
Total |
9,839,175 |
Stay Updated
Want to hear about our latest news and blogs?
Sign up now to get it straight to your inbox
