Jobs and recovery monitor - Industry
The furlough scheme has (in cumulative terms) supported 11.5 million workers across the whole of a necessary lockdown forced by a global health emergency. In supporting incomes it has supported spending in the economy and so industry or business output. But while the mass unemployment that so many feared at the start of the pandemic has been prevented, a still large number of workers across many industries have lost work. And there are still large numbers of workers on furlough.
While there are doubtless difficulties with all measures used throughout this commentary, it must be the case that there is still a great deal of hardship and uncertainty for millions of workers. This challenge should be the top priority for policymakers, rather than isolated instances of bottlenecks in specific jobs.
Immediately this means government must delay asking businesses to make contributions to the furlough scheme in July, and extend the scheme as long as needed. Even though the government has repeatedly backed down, we know these deadlines still lead to significant dislocation in the labour market.
With the end of lockdown moved forward, above all the massively damaged hospitality sector is subject to even more pressure. Ministers must step up and provide targeted support for this and other hard-pressed industries.
The government must put in place a decent safety net to protect and treat decently workers, , as well as to support spending in the economy.
An increase in sick pay to at least the level of the Real Living Wage for everyone in work would ensure workers can afford to self-isolate if they need to. Universal credit must be completely reformed, but immediately the £20 uplift must be made permanent and the five week wait for first payments ended. For those in work, the government must raise the minimum wage for all workers to £10 per hour as soon as possible and end the public sector pay freeze.
Above all the government must act to create work, in good green jobs, the public sector and caring professions. From the start of this crisis the TUC has been calling on the government to convene a national recovery council bringing together trade unions, government and employers to work together on how we build back better, fairer and more equal.
Major concerns for workers in hardest-hit industries
While recent data on jobs and the recovery have been encouraging, millions of workers still face an uncertain future. This monitor highlights differences in job prospects across industries, and looks at the relations between furlough, output and employment.
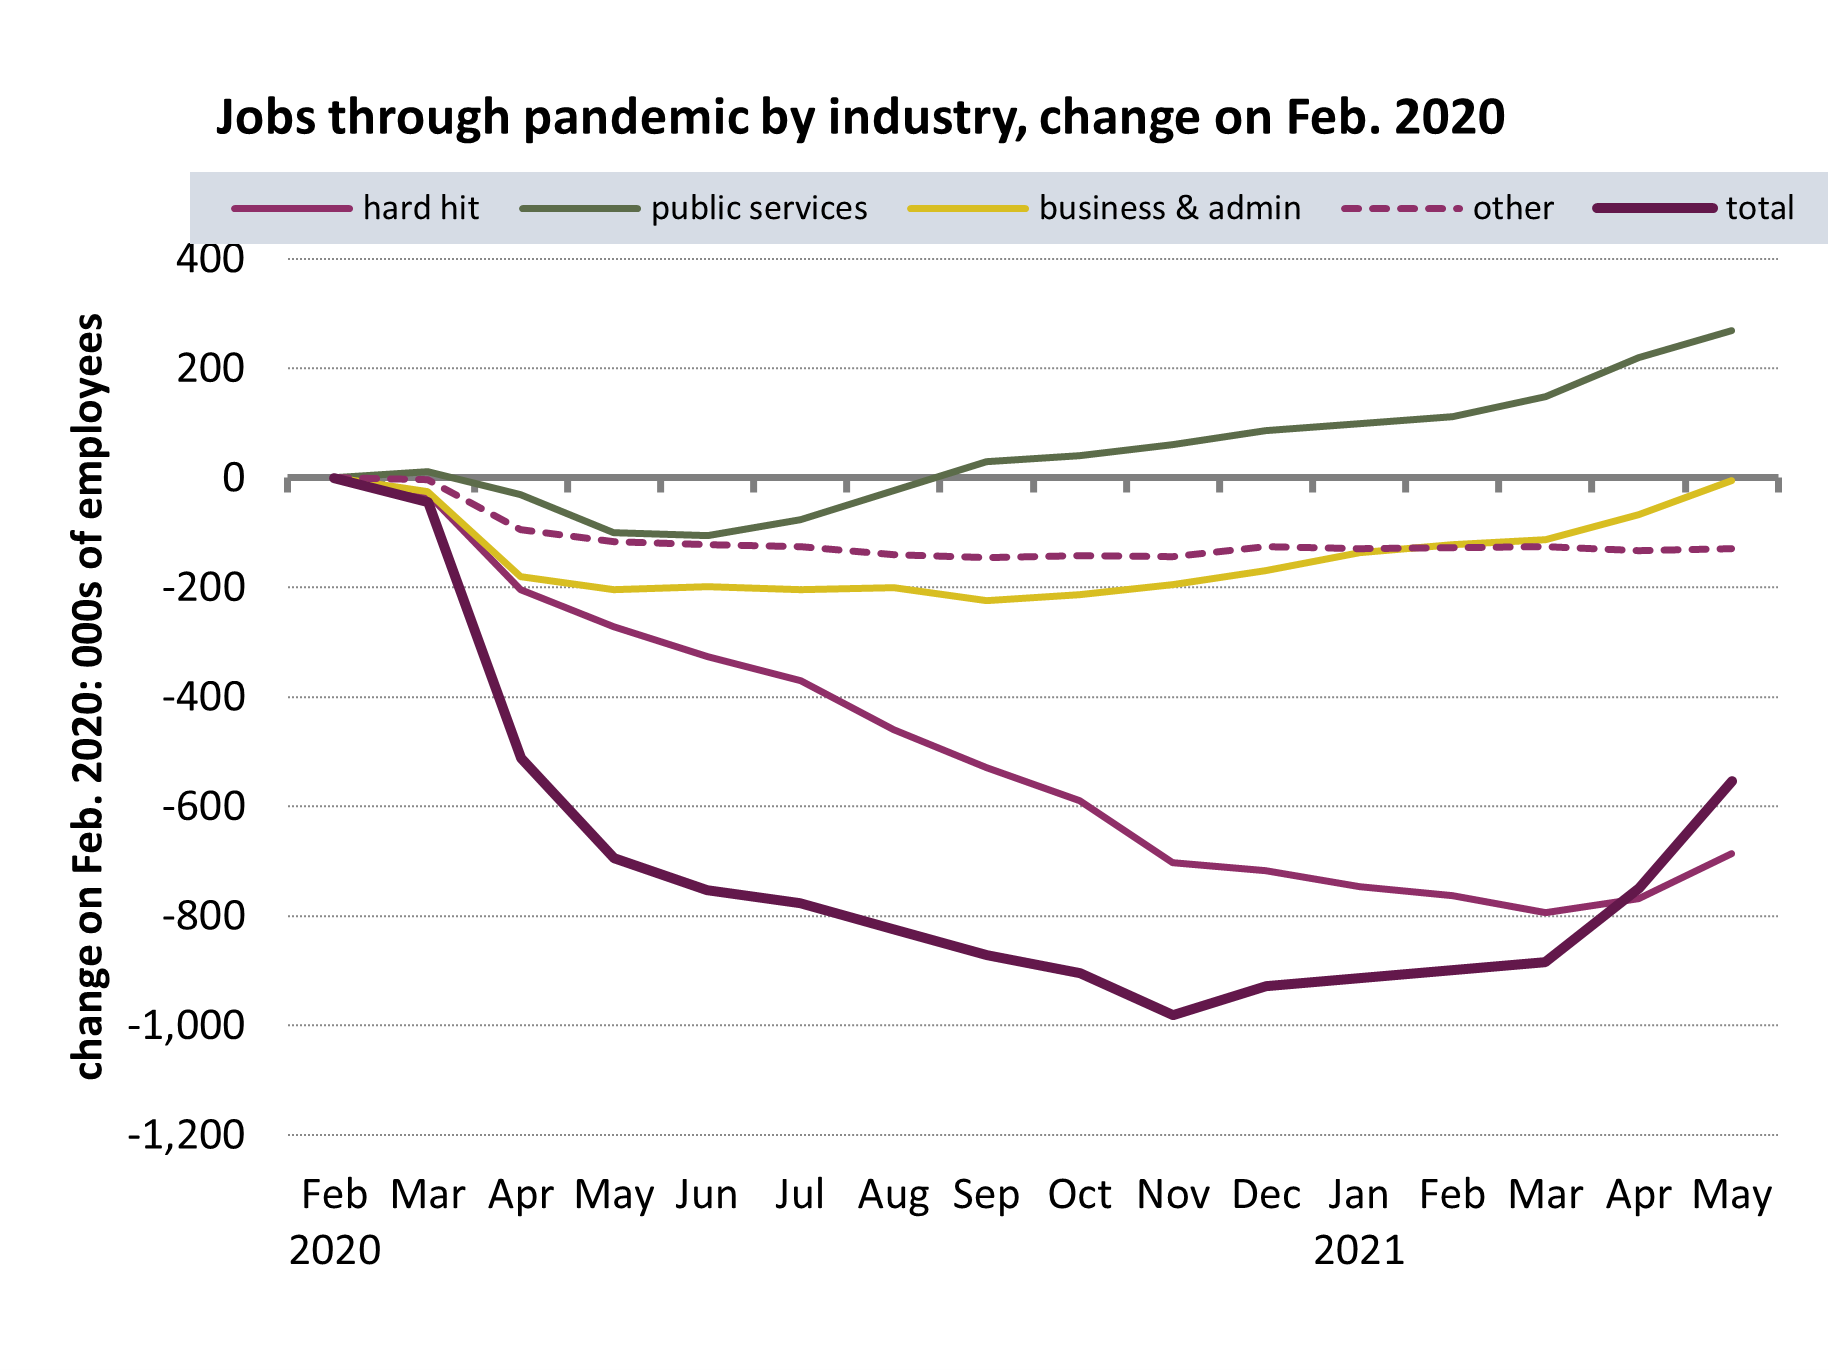
In the hardest hit parts of the economy, recent job gains have been very modest relative to previous falls, and high numbers of workers are still on furlough.
Across the economy as a whole (according to HMRC payroll figure), since peak losses in November 2020 of nearly one million employee jobs, 450,000 new jobs – more than two for every five lost - have been created.
- But across manufacturing, retail, hospitality and the arts, of a peak decline of 790,000 employee jobs, 110,000 jobs have been recovered, that’s just over one in eight.
- Lost jobs have been recovered and new jobs have been created in only two main areas:
- public services, where a decline of 110,000 has given way to an expansion of 380,000 employees.
- Business services and administration, where virtually all of 220,000 lost jobs have been regained.
For all other industries together, only 16,000 of 146,000 jobs have been recovered: one in nine.
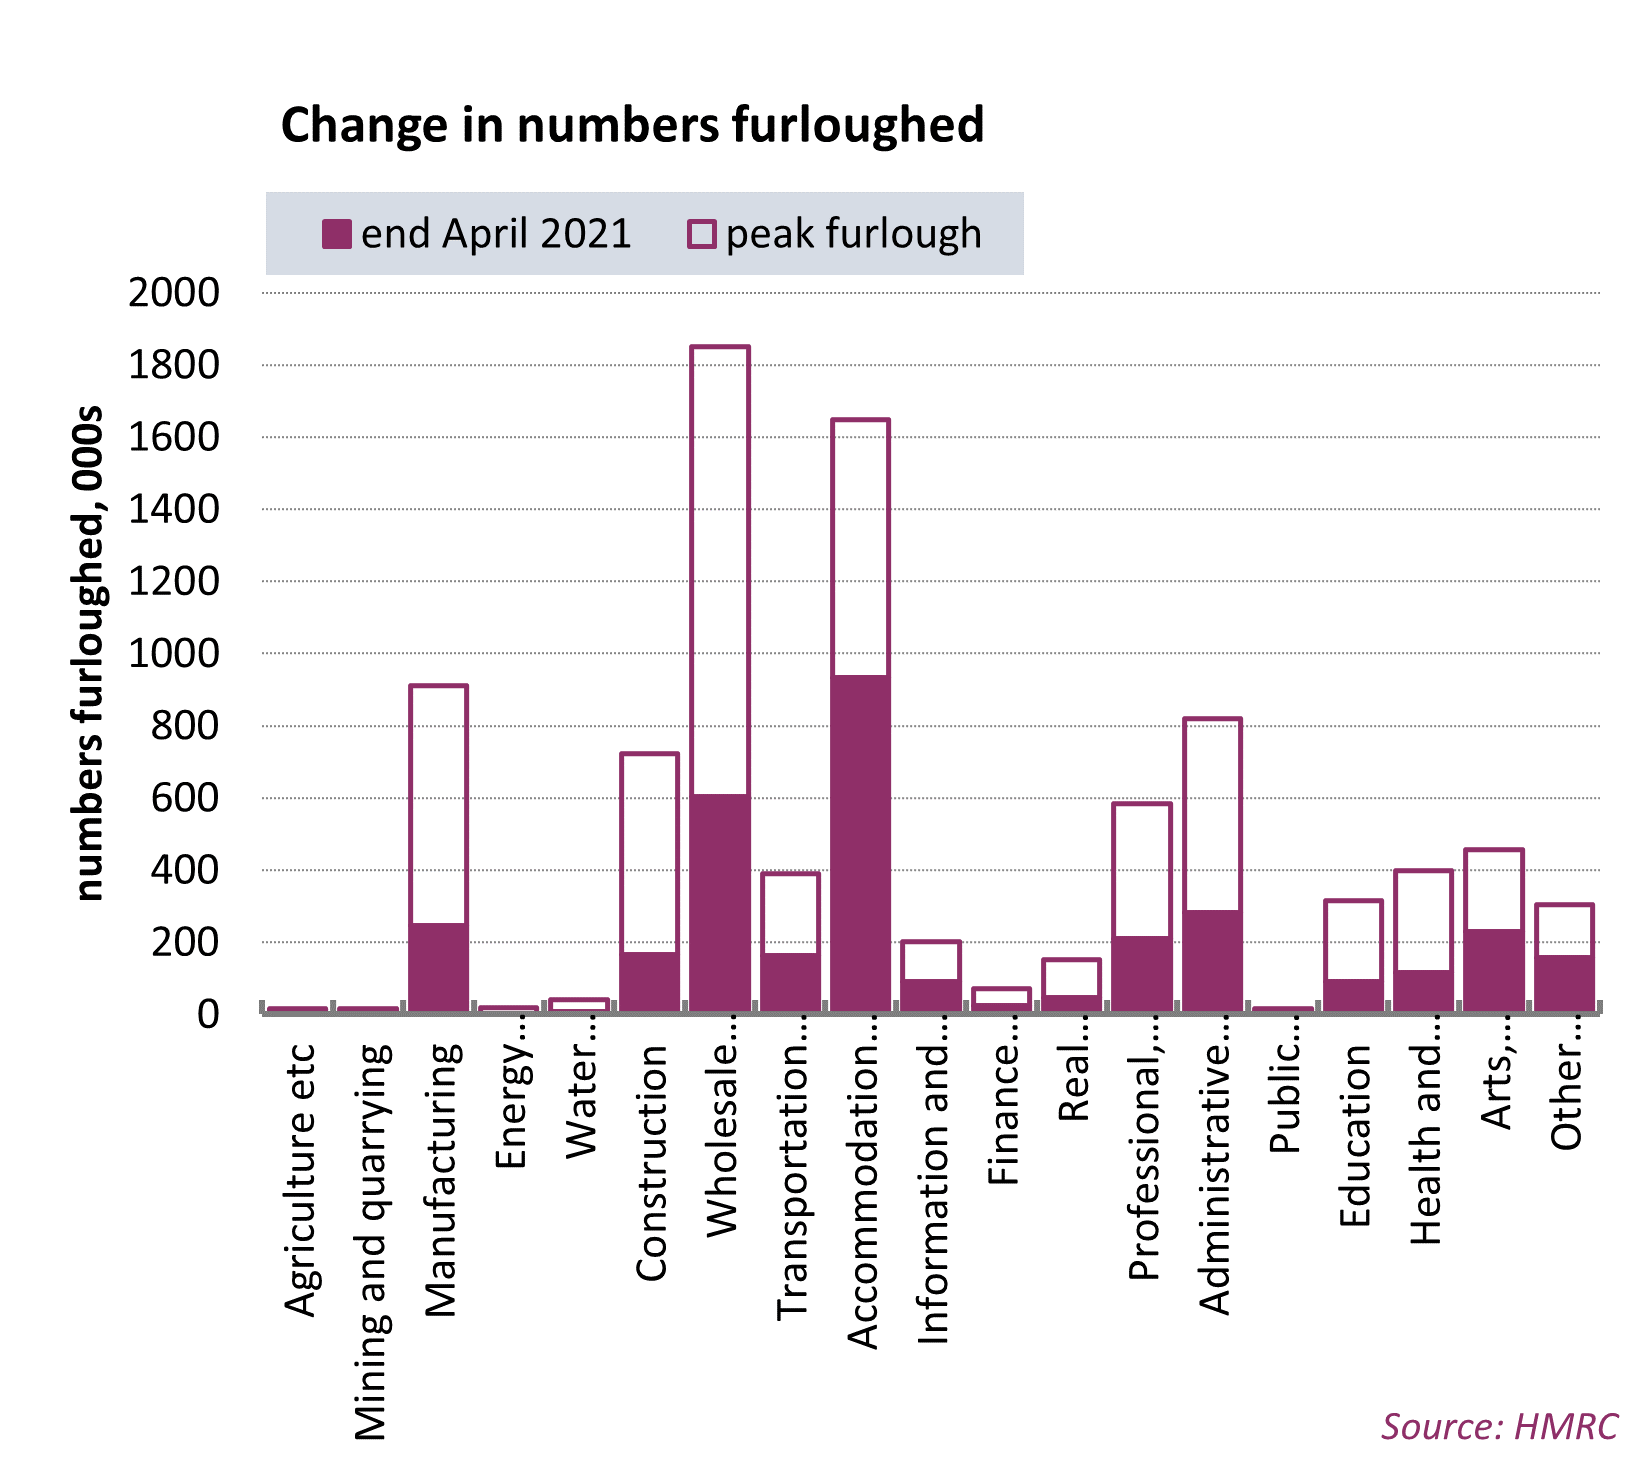
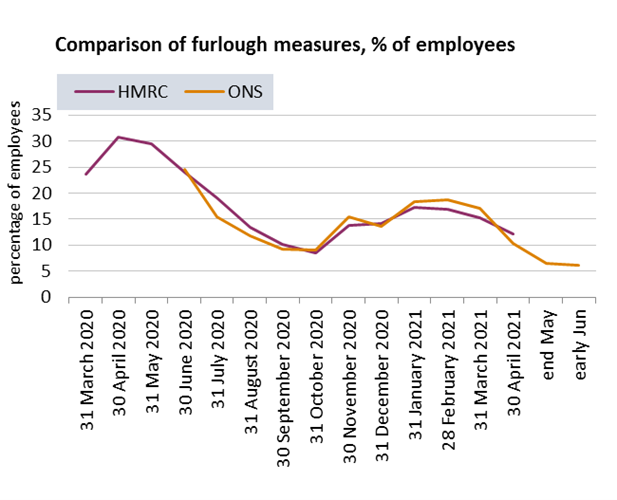
Workers in hard-hit industries are also much more likely to be furloughed; HMRC figures (for the end of April) show the four industries accounting for nearly 60% of all furloughed jobs. The HMRC figures show the furlough headcount peaking just under 9 million in April 2020, and falling by 5½ million to 3.4 million in April 2021. The more timely ONS figures suggest a further reduction to 1.5 million in the second half of June, though there are uncertainties in all these figures.
In general the performance of the economy has been closely linked to the use of the furlough scheme that has protected workers and firms through the pandemic. So far the majority of workers have returned from furlough to work, though some have not and 1.4 million were without work when the pandemic began.1
With many workers still on furlough, there are significant risks for workers from the start of July when the government requires companies to make progressively larger contributions to the scheme.2
We urge the government to continue to operate the system with no employer contributions while current restrictions are in place, and to extend it for as long as support is needed to protect jobs. The government must also do much more to support job creation.
Previous monitors on gender, Black and Minority Ethnic workers, young workers and regions, highlight how the pandemic is exacerbating existing inequalities. The TUC has also highlighted how the pay and employment gap for disabled workers has been widening.3
Jobs and recovery: headlines
Gross domestic product (GDP) data show the economy recovering relatively quickly as the second round of lockdown measures have been progressively eased over 2021.
Monthly GDP growth was 2.1% in March and 2.3% in April. This is likely a faster pace than expected in May 2021 by the Bank of England, who reckoned GDP would recover the pre-pandemic position in the final quarter of 2021.
Some labour market measures are also beginning to improve, with for example the unemployment rate now falling back to 4.7%, having risen from 3.8% before the pandemic to a peak of 5.0%. On headcount: unemployment rose by 360,000 to peak at 1,700,000 in Nov.-Jan. 2021 and has now fallen back by 90,000 to 1,610 in Feb.-Apr. 2021. But these Labour Force Survey figures likely understate the overall position following difficulties accounting for the movements of non-UK born workers.4
Other sources measure the employment position by industry, and show a bigger deterioration. So-called workforce jobs figures suggest a peak of 850,000 employee jobs lost at the end of 2020, with a gain of only 110,000 into first quarter. These are less timely than the new HMRC payrolled jobs figures now extending into May, and on which the majority of the discussion in this report is based. Both sets of industry figures show broadly the same story overall. Note this monitor does not address additional and potentially large falls in self-employment.
Furlough, GDP and jobs
The progress of the economy since the start of the pandemic has reflected lockdown measures. Statistics on the furlough scheme provide a proxy for the extent of lockdown over the course of the pandemic. Figure 1 shows headline numbers in a format that will be used throughout the report for industry analysis.5
- 1 The Resolution Foundation found 81% of workers who were on furlough in April 2020 back in work: https://www.resolutionfoundation.org/publications/understanding-the-labour-market/
- 2 From 1 July 2021 the level of government grant is reduced and firms will be asked to contribute towards the cost of furloughed employees’ wages. To be eligible for the reduced grant firms will have to continue to pay 80% of wages, with the government grant reducing to 70% in July,and 60% in August and September; the cap on furlough payments will reduce from £2500 at present to £2187.50 in July and £1875 in August and September. On present plans – and routinely plans have changed at the last minute – the scheme will end at the end of September. https://www.gov.uk/government/publications/changes-to-the-coronavirus-j…
- 3 https://www.tuc.org.uk/news/disabled-workers-earning-fifth-less-non-disabled-peers-tuc-analysis-reveals and https://www.tuc.org.uk/research-analysis/reports/disability-pay-and-employment-gaps
- 4 https://blog.ons.gov.uk/2021/03/23/exploring-how-the-uk-population-and-…
- 5 Output is measured by monthly GDP figures, indexed to equal 100 at the start of the pandemic in February 2020; workers on furlough is shown as a percentage of employees; employees are measured by HMRC real time information, and showed in thousands (on the right hand scale). The sources for data used throughout this commentary are ONS and HMRC, with calculations by the TUC.
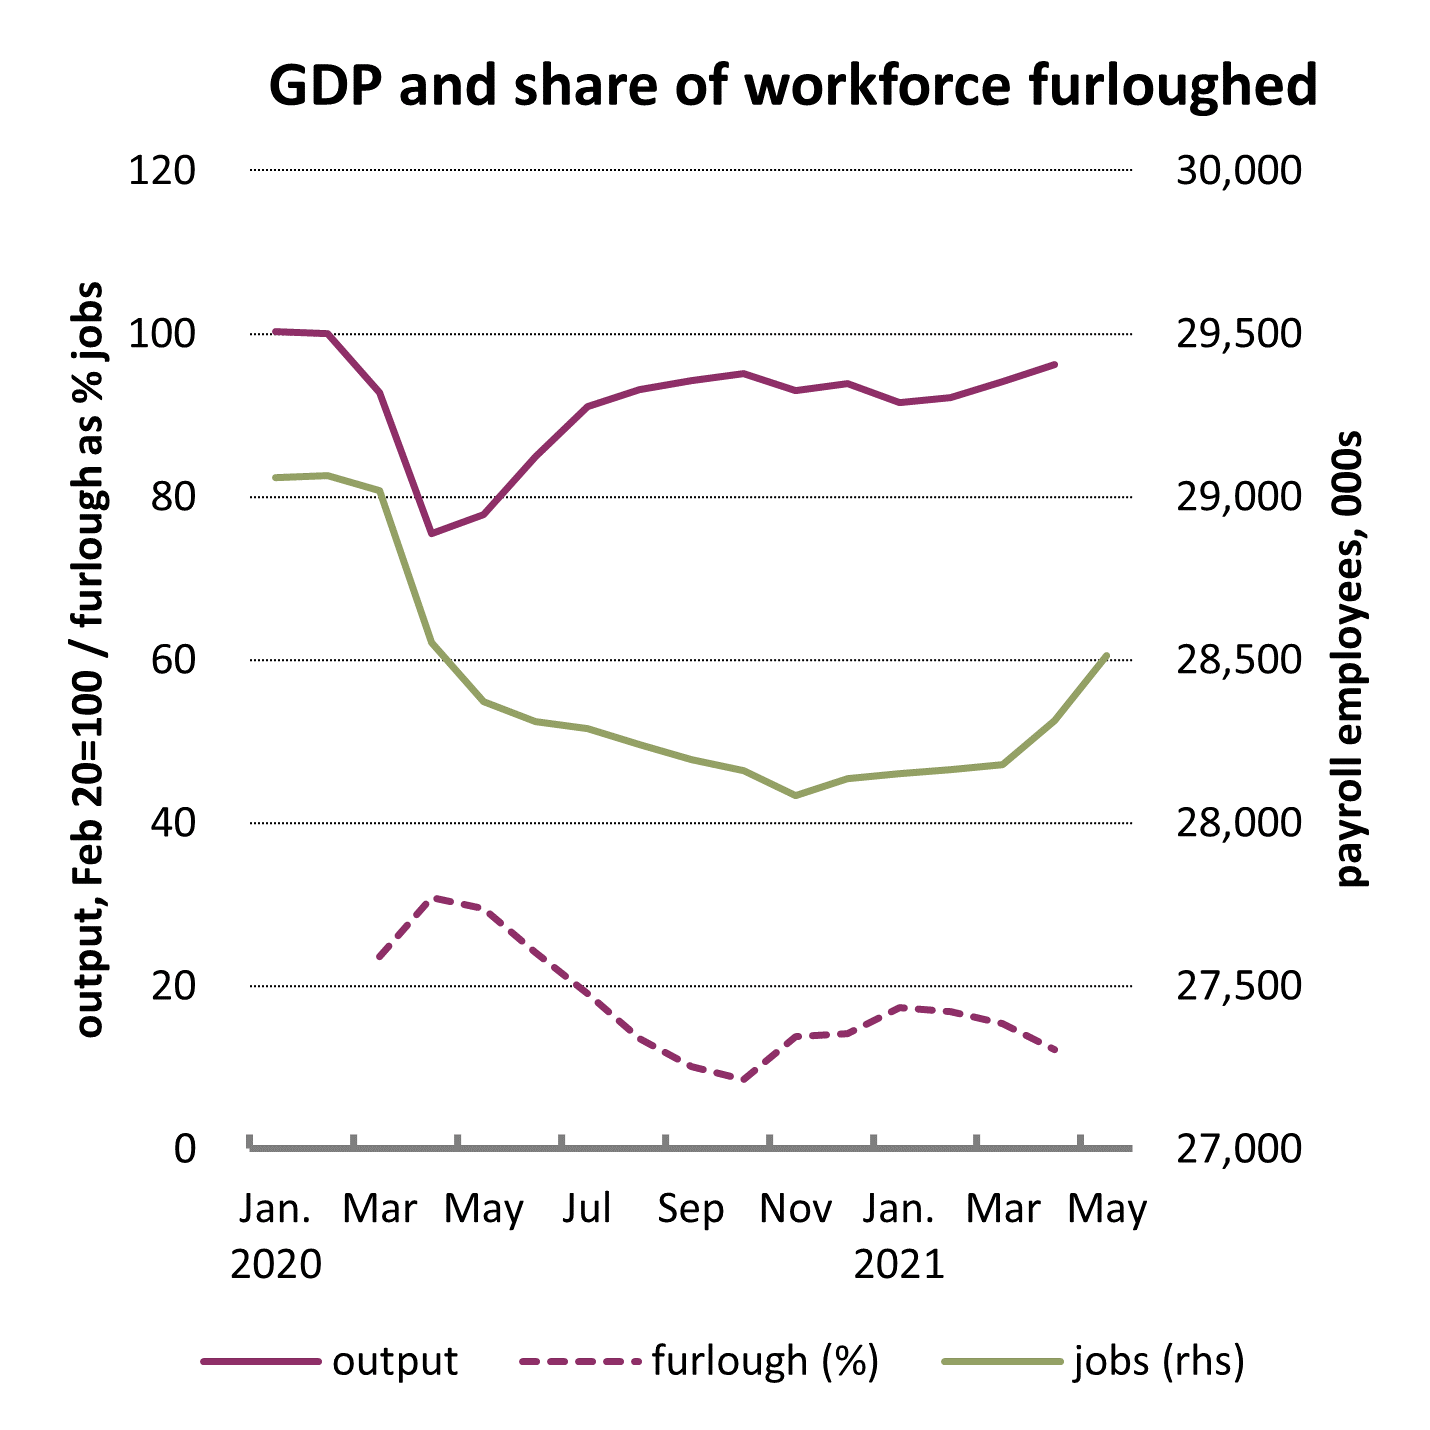
At the peak of lockdown in April 2020 just over 30% of employees were furloughed. At that point GDP was down by 25%. GDP then revived rapidly as lockdown was relaxed. The second lockdown meant furlough rates back up to 17%. While still a significant share of the workforce, this time GDP only declined by 3.7% between October 2020 and January 2021. This may be partly explained by higher numbers on partial furlough than full furlough, peaking at 1.5 million in the second lockdown compared with 1.25 million in the first (and accounting for 41.6% of all furloughed jobs in April 2021). As the lockdown was eased, GDP has picked up.
At the end of April, in spite of a furlough rate still relatively elevated at 12% (3.4 million employees), output was only 4% below the pre-pandemic level. There are likely uncertainties surrounding all of these figures. As discussed below, the ONS now estimate furlough in June has fallen to 1.5 million. On the other hand figures for total hours worked matched GDP relatively closely at the start of the decline, and now stand 7.3% below the pre-crisis level.
The movements in payrolled employees operate on a different timing, and are relatively less severe than in GDP. The peak decline was 980,000 employee jobs between February and November 2020 (a fall of 3.4%), and afterwards 430,000 jobs were created through to May 2021, so that overall employee jobs stand 550,000 (or 1.9%) below the pre-pandemic level. More than two jobs have been created for every five lost.
But while positive overall, the story is very different by industry. Above all, the areas where jobs have been created are not generally those where they have been lost.
Looking at employees by industry
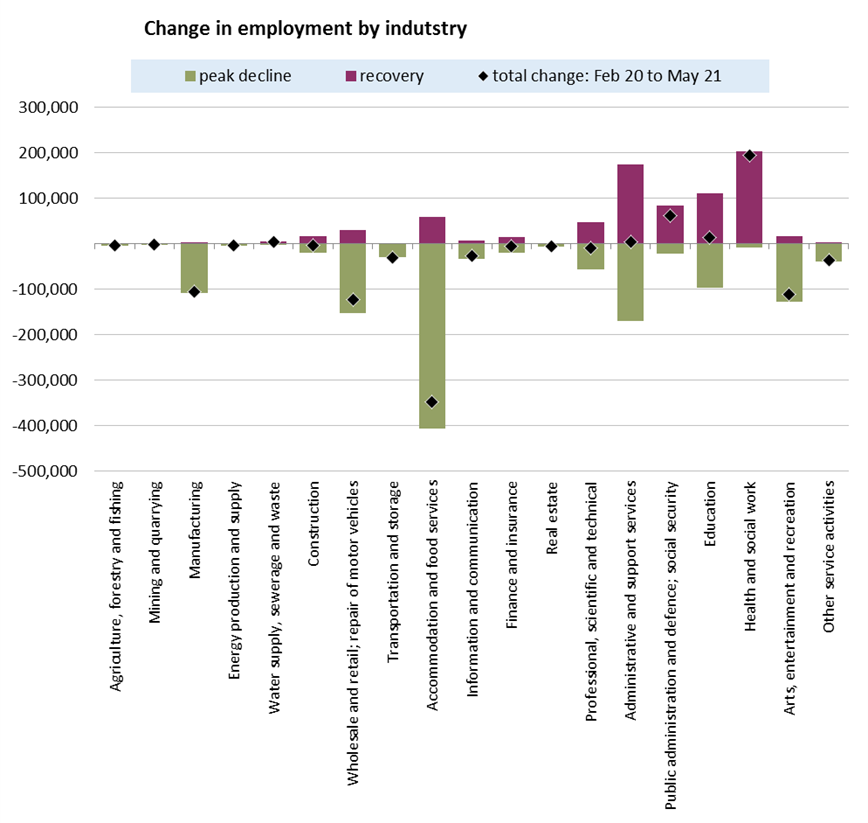
The chart below shows clearly how the largest falls in employment (in grey) are concentrated in a handful of industries, and the main gains in employment (in purple) are also concentrated in a handful of – (mainly) different – industries.
Of a peak decline of 790,000 jobs across manufacturing, retail (wholesale and retail; repair of motorcycles), hospitality (accommodation and food services) and the arts (arts, entertainment and recreation), only 110,000 jobs have been brought back: that’s just over one in eight.
Lost jobs have been recovered and new jobs have been created in only two main areas:
- Public services (public administration and defence, education and health and social care) where a decline of 110,000 has given way to an expansion of 380,000 employees.
- The professional services and (private) administration categories, where nearly all of 220,000 jobs lost have been regained.
Looking at Furlough by industry
The numbers on furlough track the extent of the lockdown and have mirrored closely the overall movements in the economy. At the peak of the lockdown HMRC figures show just 8.9 employments were furloughed. As lockdown was eased the numbers fell to 2.5 million. They rose again to 5 million in the second lockdown and now (at the end of April 2021) stand at 3.4 million.
By industry the story is similar to the employment numbers. Overall furlough is down by 60% on the peak, and large falls are seen across the board. However especially in the ‘hard-hit industries’, a large number of employees are still on furlough. Across manufacturing, retail, hospitality and arts a total of 2.0 million workers are furloughed; these four industries account for 58% of all furloughed jobs. Over time this share has varied moderately, accounting for 55% of jobs at ‘peak furlough’ and 51% at ‘low furlough’.
Overall, though, these figures are less timely than the ONS Business Insights and Conditions Survey (BICS). As a percentage of employees, ONS figures show an April figure of 10.3% falling to 6.1% in June, equivalent now to 1.5 million workers. The chart below shows that in general the two sets of figures match well over time, with the HMRC figures a little smoother. 6
- 6 The match by industry may be a little less good; for example at the last comparable point in April across hard-hit industries ONS figures were significantly lower across the board: ONS showed 6% against HMRC at 11% in manufacturing; 7% against 14% for retail; 31% against 55% for hospitality; and 34% against 48% for arts.
Over time: furlough, output and jobs by industry
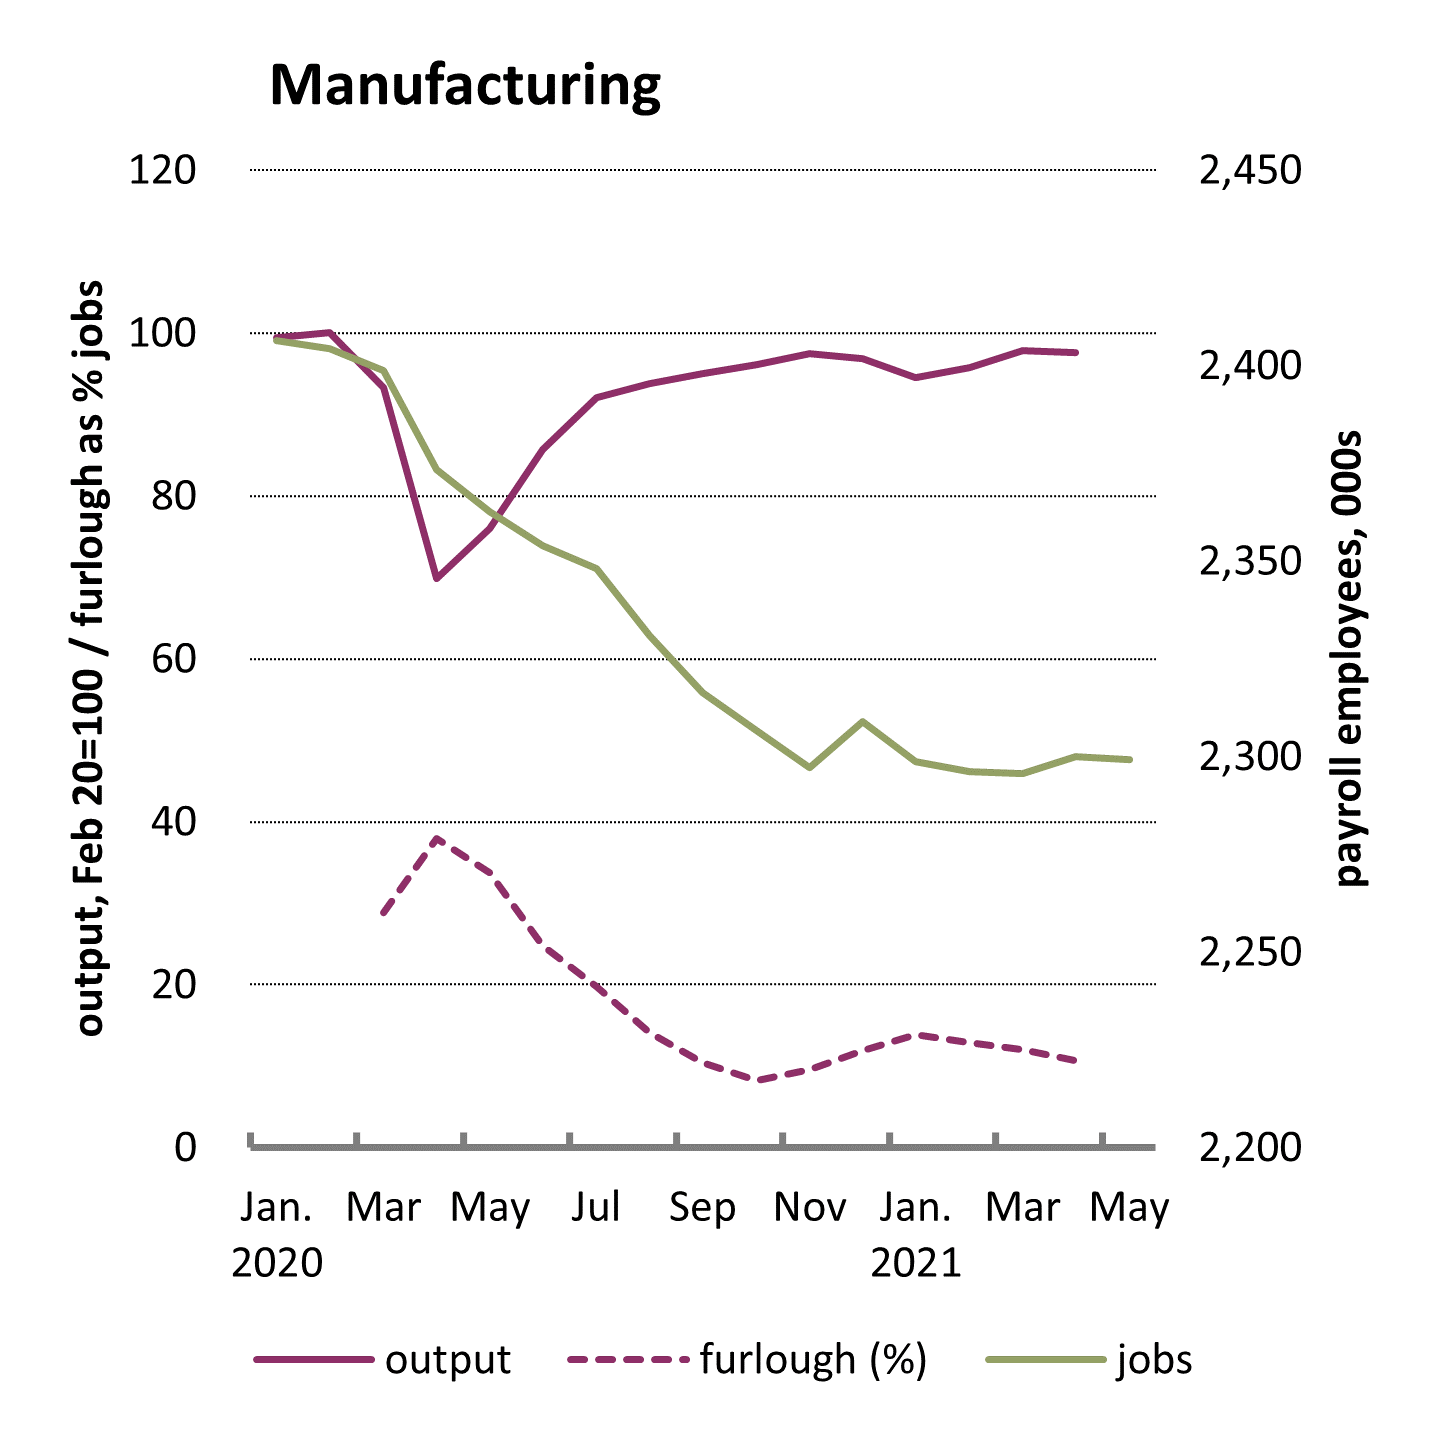
Manufacturing and retail
In manufacturing industries a peak of 38% of employees were on furlough, matched closely by a peak decline of 35% in output. As furloughed workers returned, output steadily recovered. In the second lockdown furlough was more limited, increasing to 14% in January 2021 following a low point of 8% in September 2020, and now standing at 11%.
Over 2020 jobs fell by 100,000 from 2.4 million to 2.3 million; the decline halted during 2021 but there have been no subsequent gains.
Retail (wholesale and retail; repair of motor vehicles) is similar to manufacturing, with peak furlough of 41% and output decline of 35%. Output recovered quickly to regain the pre-crisis peak, but was set back during the second lockdown.
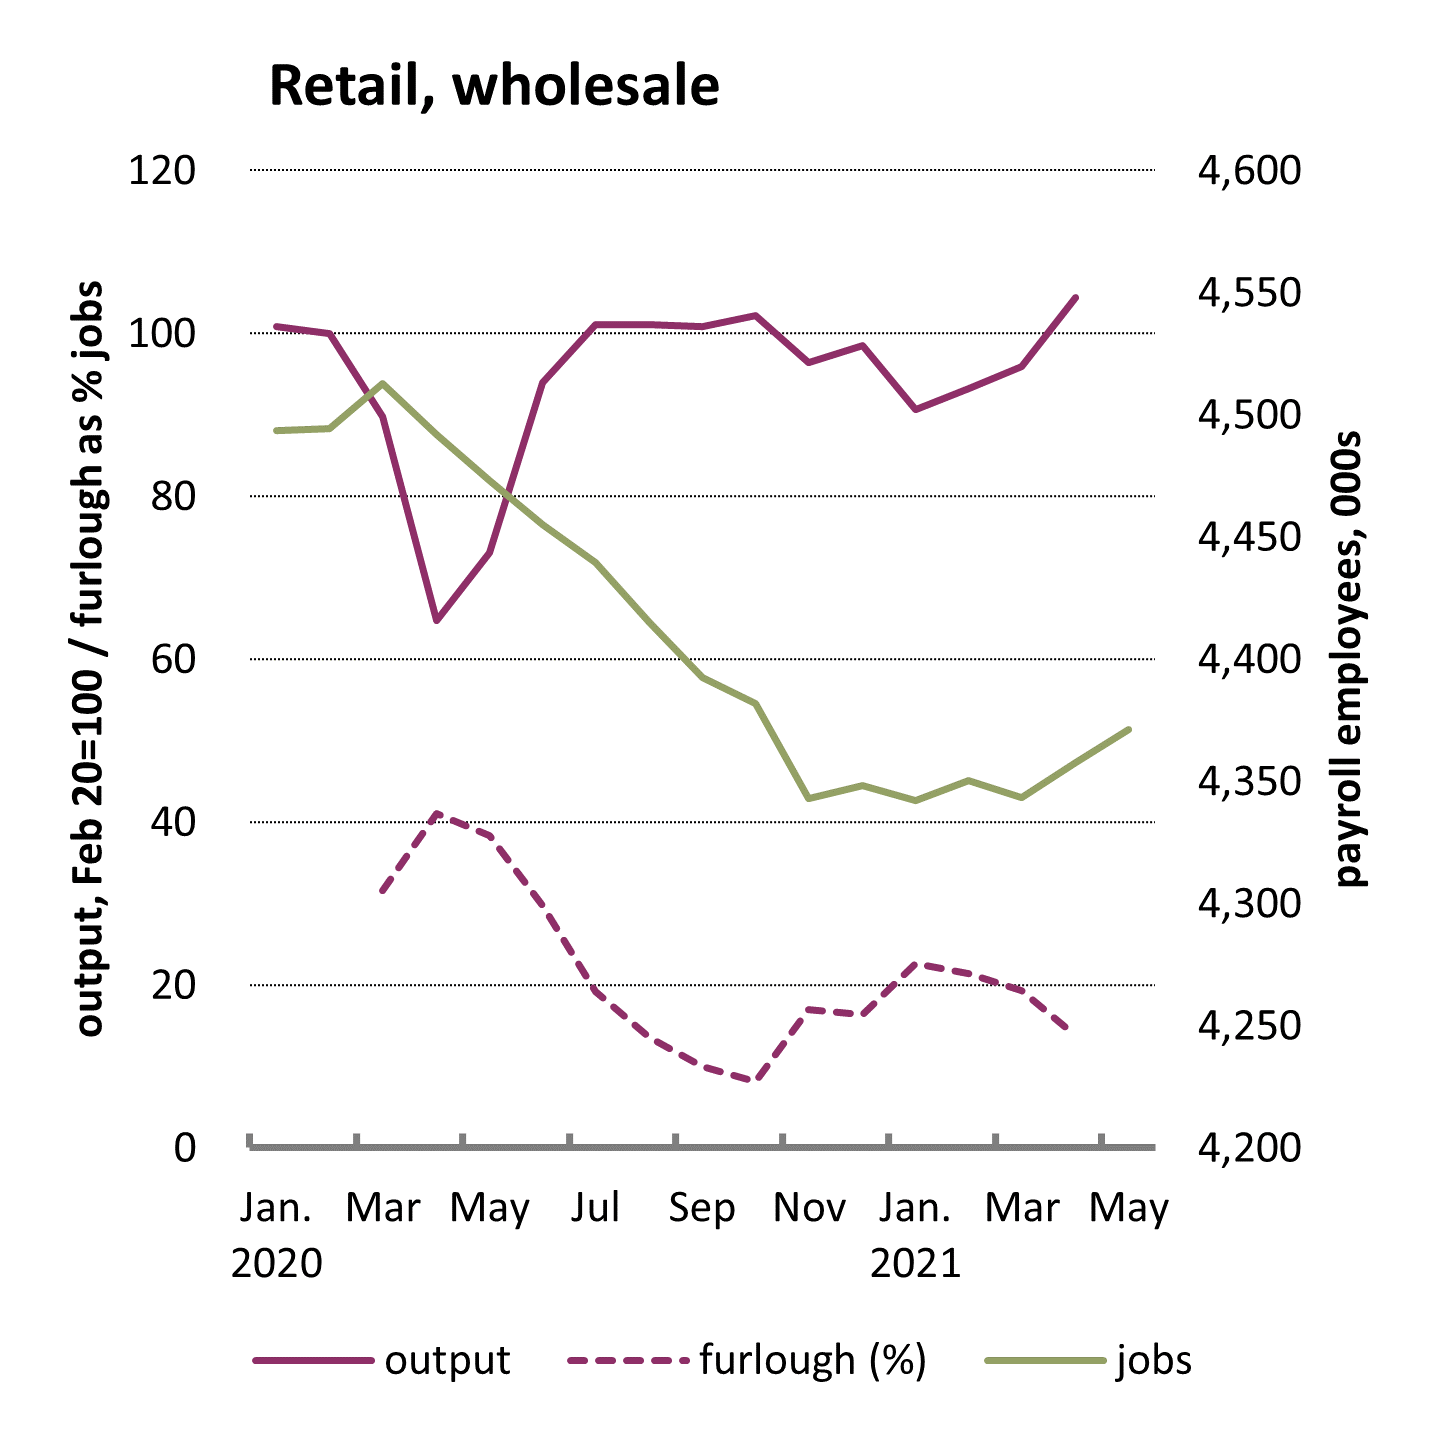
As the second lockdown has come to an end, growth has been rapid and output stood 4.5% above the pre-crisis level in April. As widely understood, throughout lockdown online retail grew vigorously while sales in the high street fell back (for example between 2019 and 2020 on-line rose 30% while in-store fell 12%) .
This expansion came as the furlough rate fell from 23% to 14%. The recovery in output is less evident in jobs, which had fallen from 4,510,000 to 4,340,000. Over April and May as lockdown further eased jobs were up 30,000 to 4,370,000.
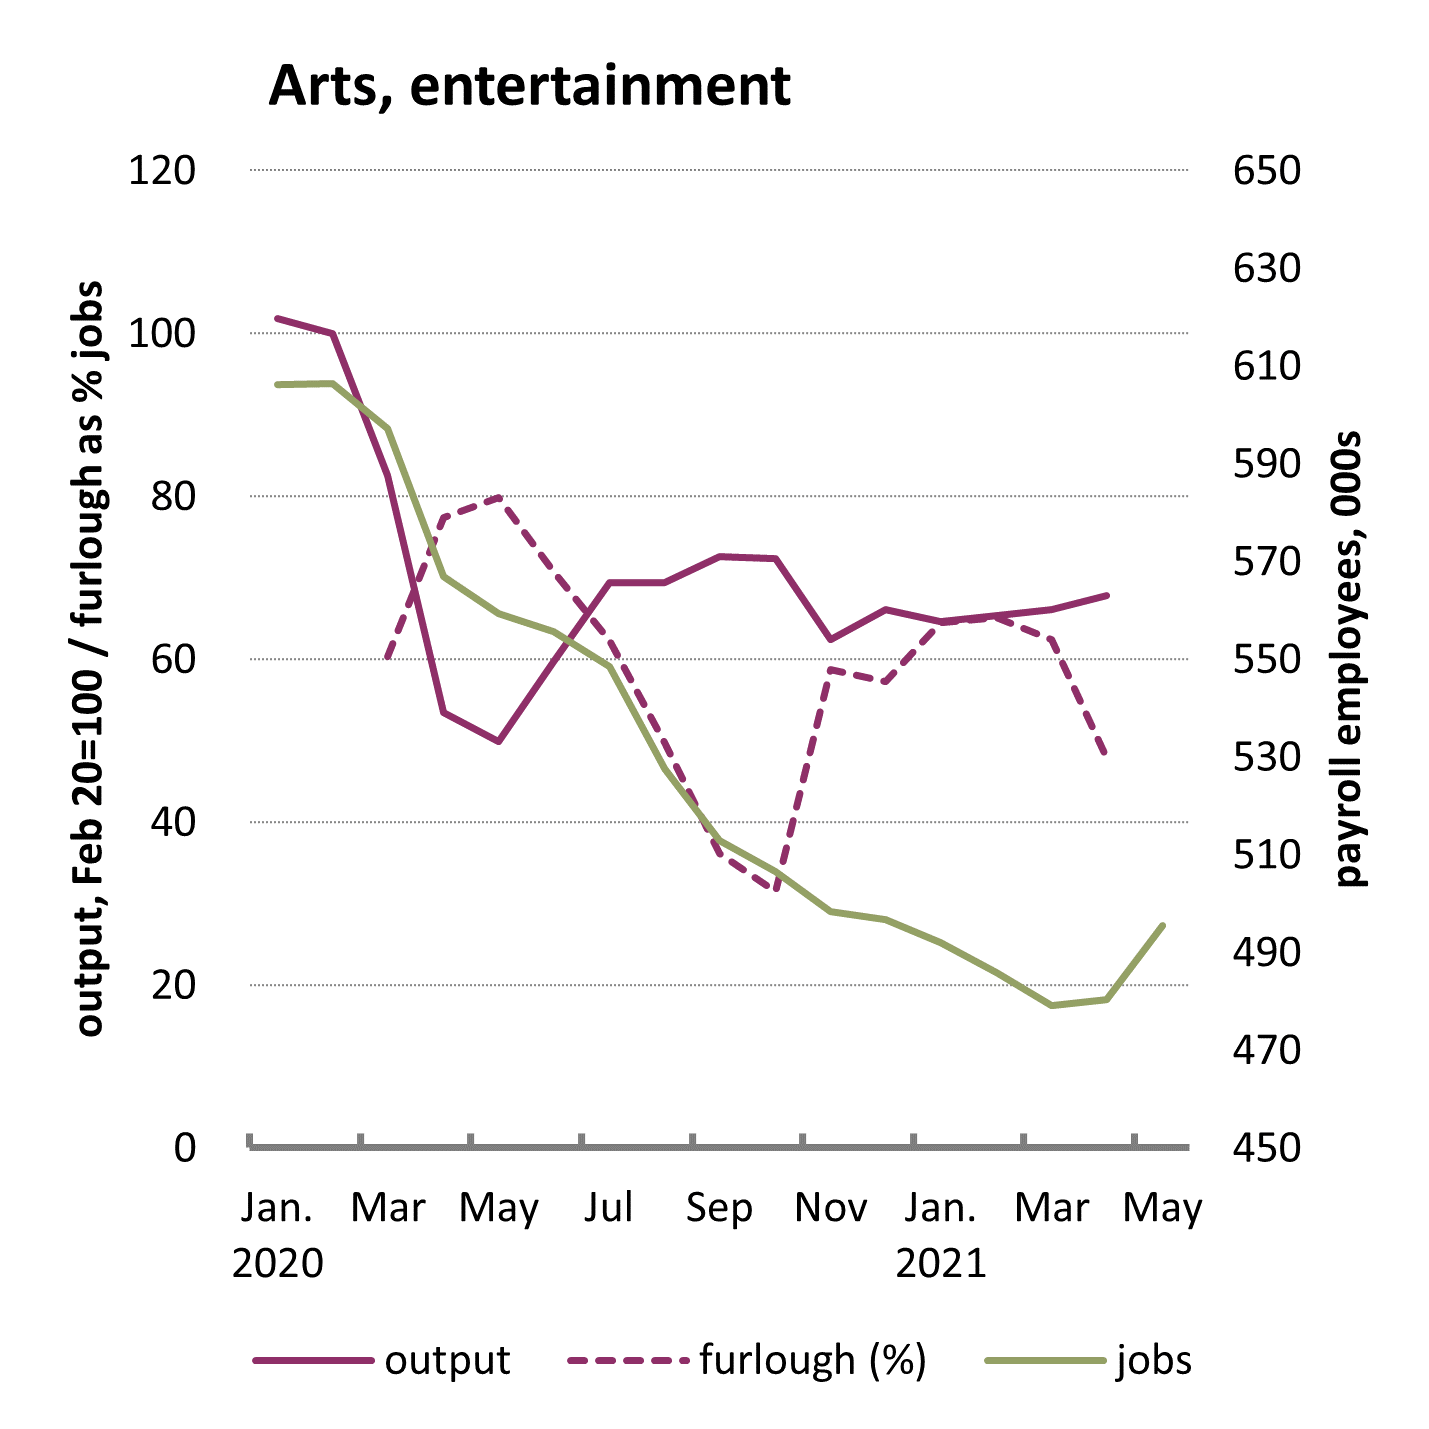
Hospitality and the arts
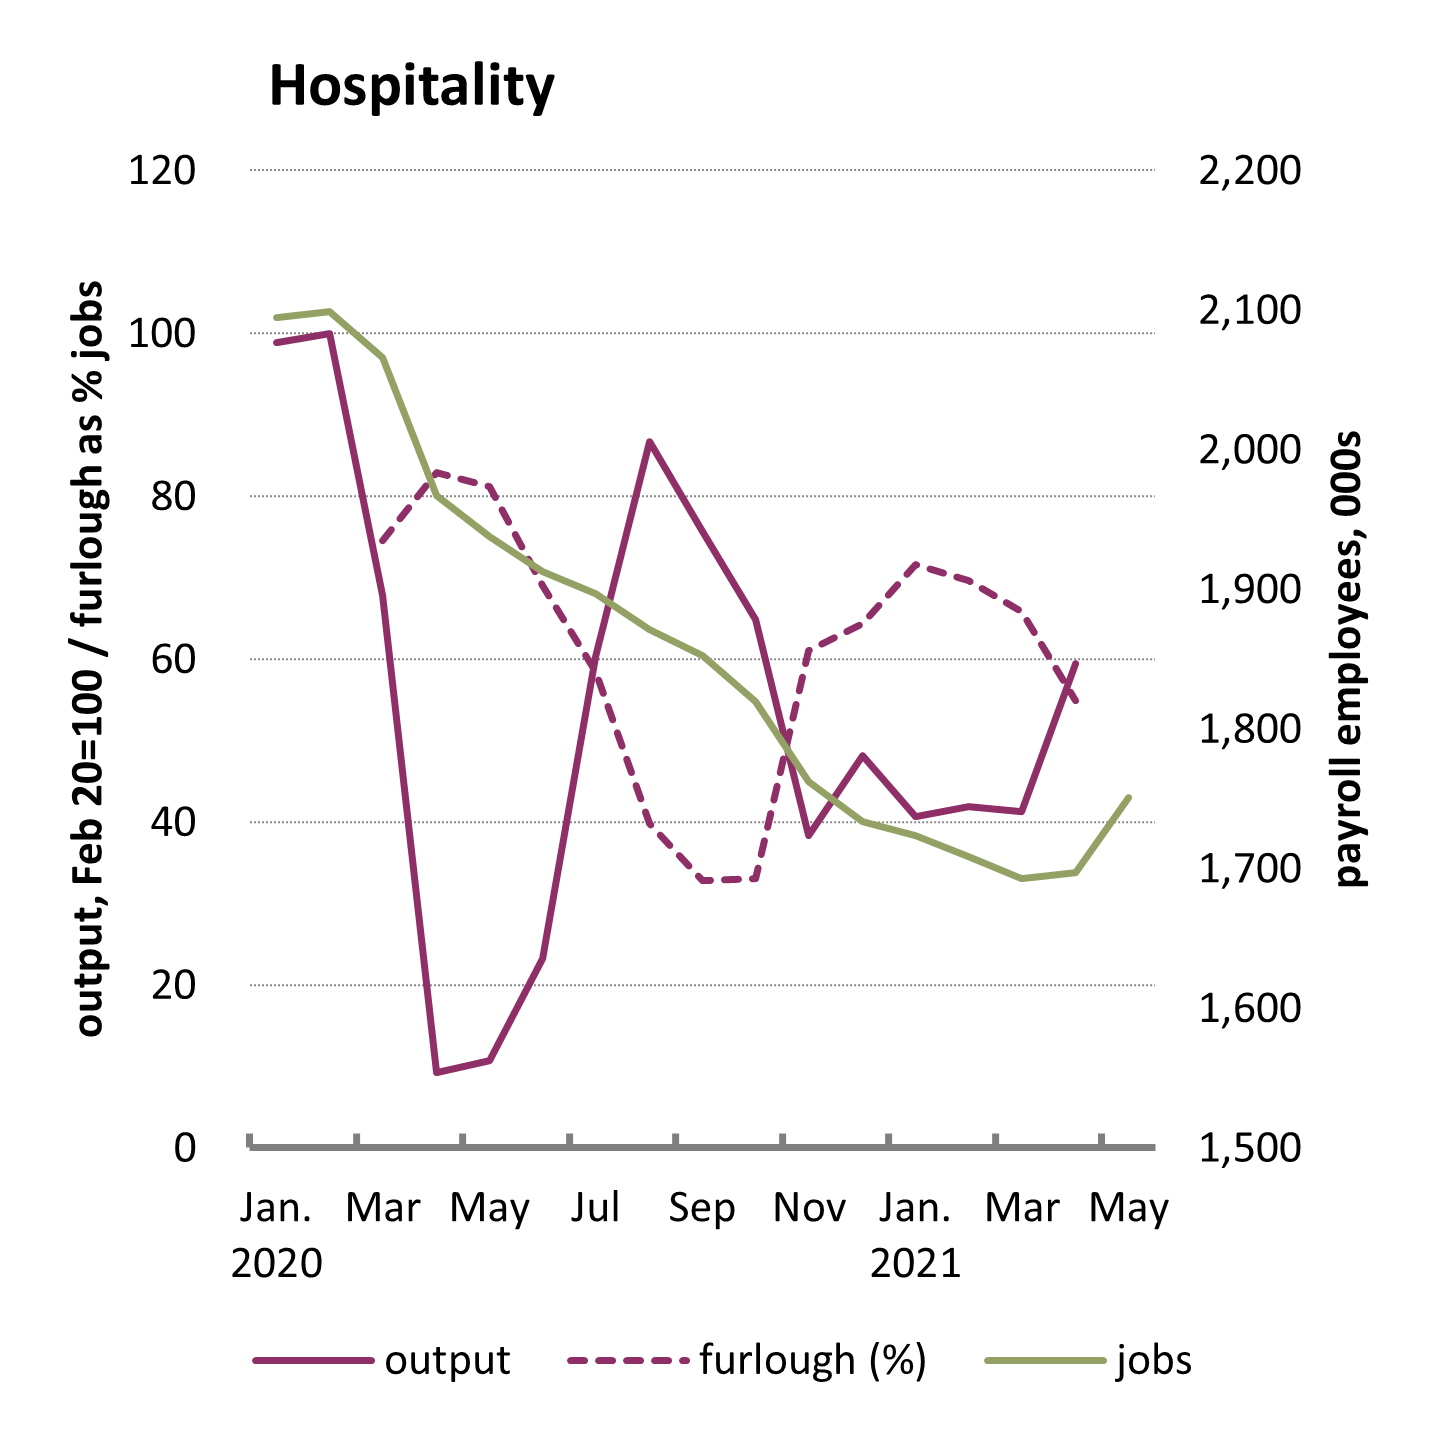
Hospitality (accommodation and food services) and arts (arts, entertainment and recreation) are at the sharpest end of lockdown. Still very high furlough rates hold output low and there has been a good deal of job loss, likely as insecure working arrangements have made it too easy to jettison employees.
At the peak of lockdown in April 2020 a furlough rate of 80% drove output down nearly to nothing, falling by 90% between February and March. While the reckless ‘eat out to help out’ scheme meant a revival, there was an abrupt reversal with the second lockdown (when furlough peaked at 72%).
At the end of April 2021 furlough rates were still just under 60% and output down 40%. Until the latest month, the number of employees had steadily declined over the whole of the pandemic. Payrolls fell 400,000 between February 2020 and April 2021, but have now lifted 50,000 into May.
In our Jobs and recovery monitor on gender we observed how in both retail and hospitality women are disproportionately represented making up nearly 60% of the workforce, and so are harder hit and facing more insecurity than men.
In Arts and entertainment the furlough rate peaked at 80%, with output down basically by half. After gaining a little of the lost ground, output has remained around 30% below the pre-pandemic level. Furlough rates were back up over 60% in the second lockdown, but a relatively sharp reduction to 48% in April has been matched by a slight revival in Jobs. But overall employment is down 18%, from 600,000 to 500,000.
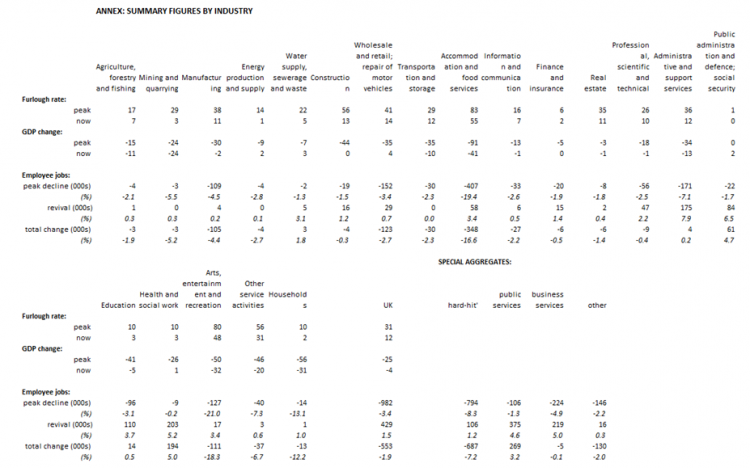
The table in the annex summarises the key movements across furlough, output and employee jobs across all published industry groupings. As noted in the summary section the ‘other’ category – i.e. the residual from the identified groups – also showed a fall overall in employment and only the slightest recovery.
More specifically, agriculture, mining and quarrying, energy production and supply, transport and storage, information and communication, other services and ‘households’ have seen relatively steep falls in employment but almost no recovery. The figures do not come through in headlines because these industries account for fewer jobs overall. Furlough numbers vary, as do the extent of the change in GDP.
Business services and administration
Business services saw a sharp decline followed by a corresponding recovery. With a furlough rate peaking at 25%, output declined by 20%. Output has since made up most of the lost ground, though the furlough rate in April was still at 10%. Jobs declined by 50,000 and then rebounded.
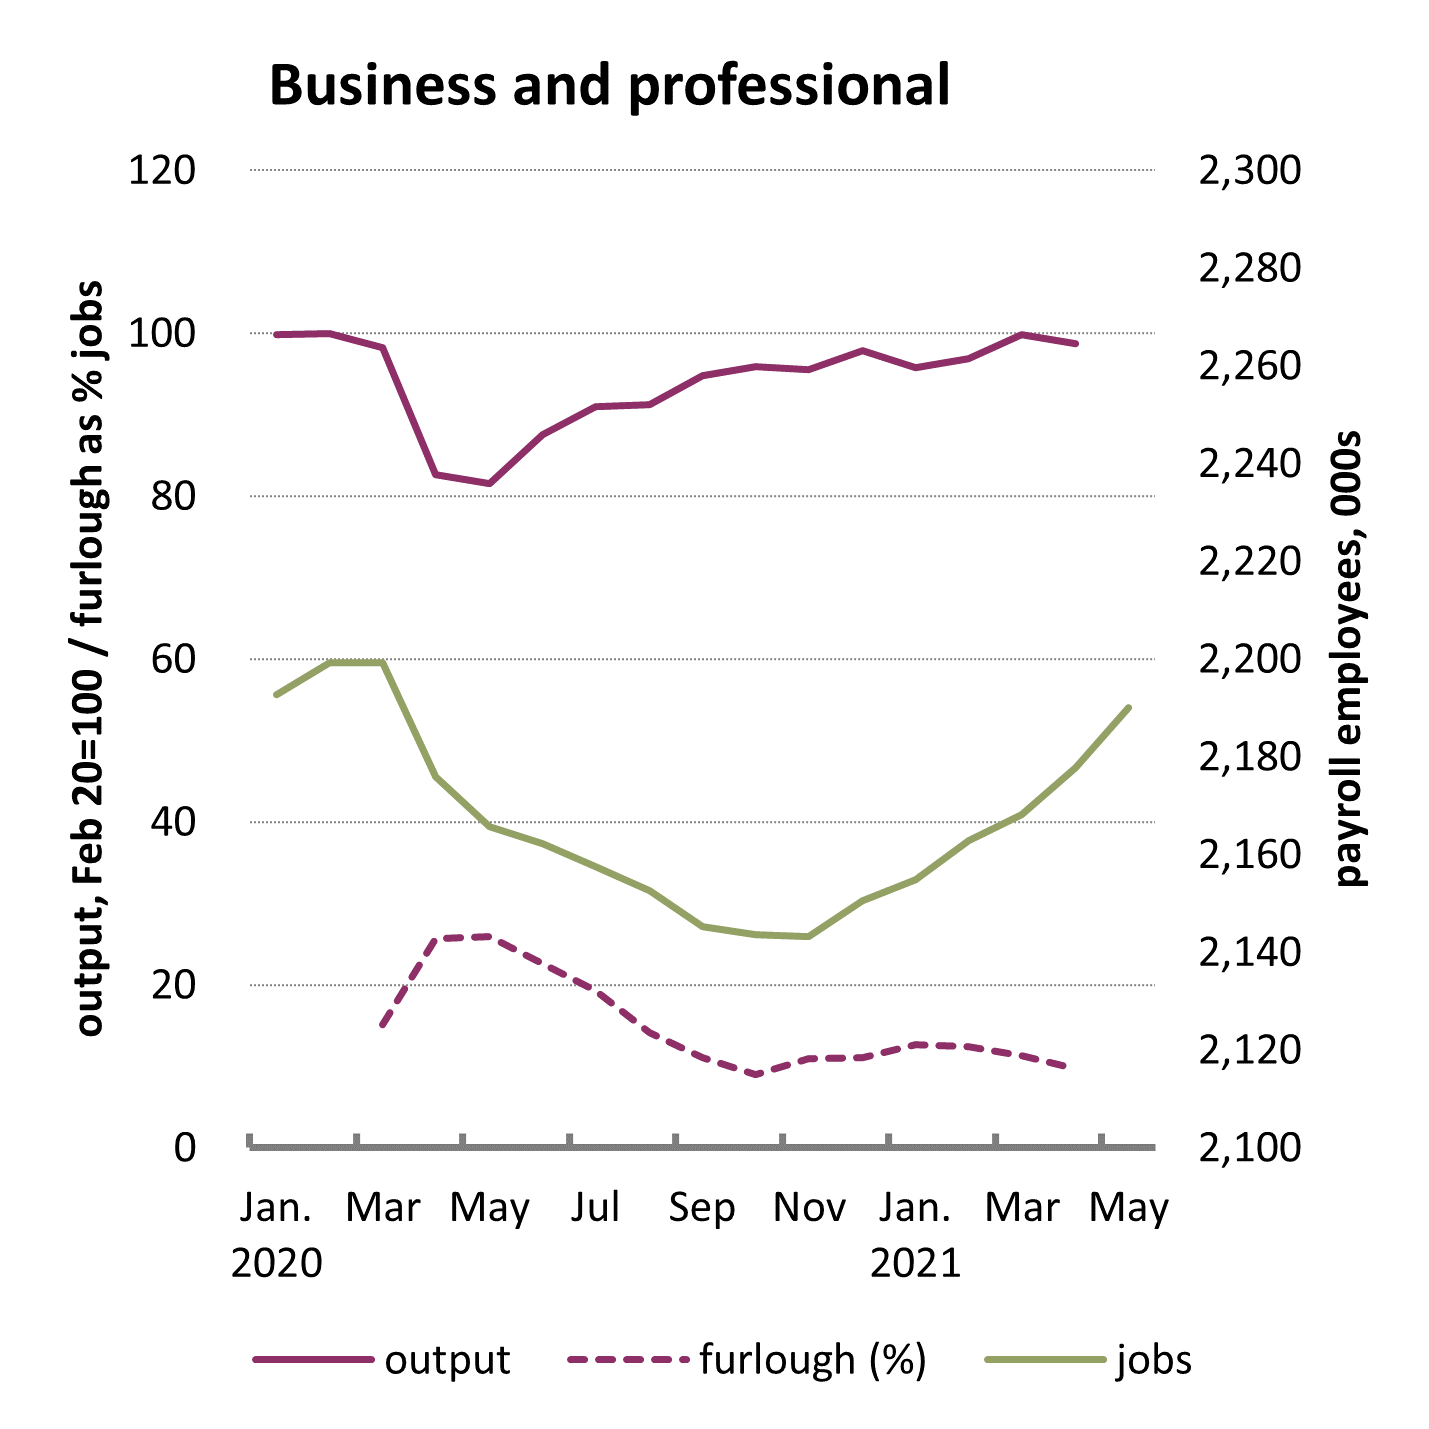
These changes were similar to administration and support services, The other industries where jobs or output fell and then recovered were ‘water supply, sewerage and waste’, construction, finance and insurance, and real estate (see table in annex).
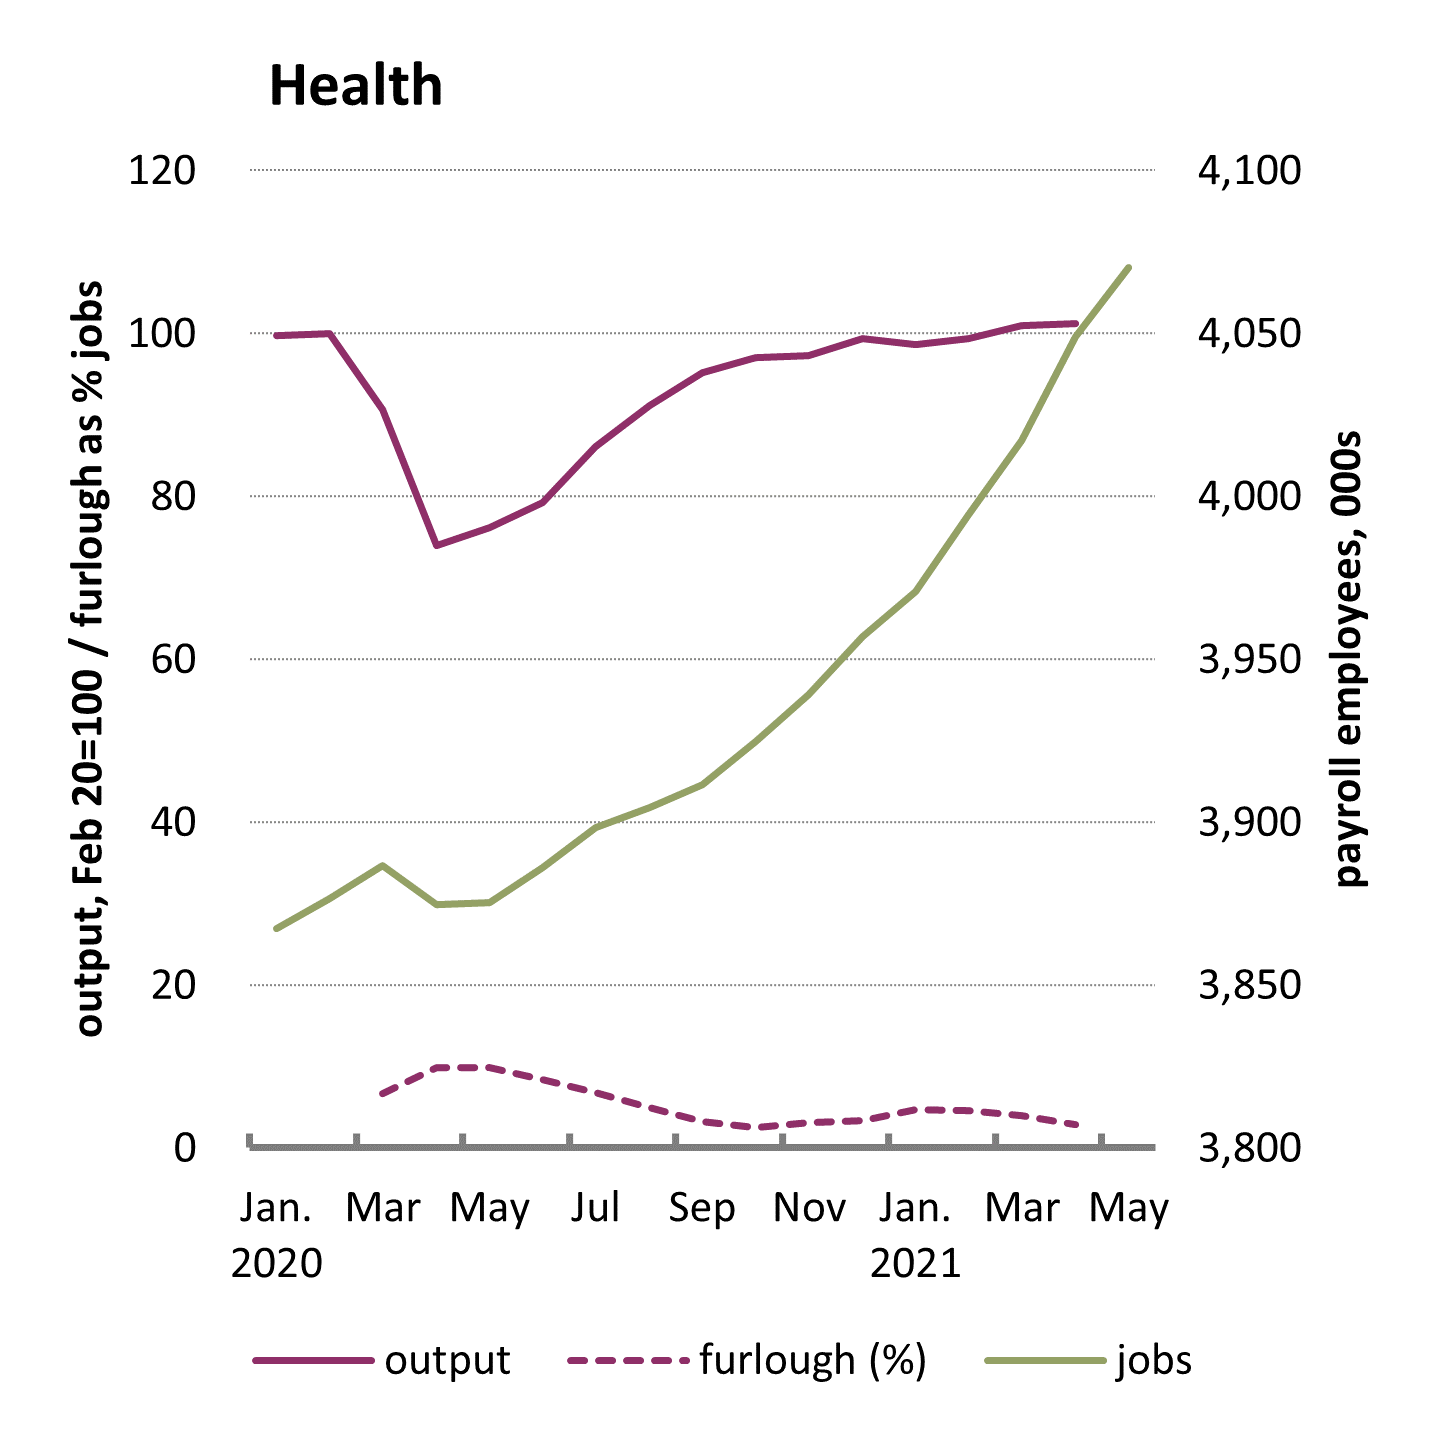
Public services
Health and social care is naturally central to the pandemic economy. Here and in other public services, the use of furlough has been minimal. But the output indicator for health surprisingly still shows a hefty hit, as a result of peculiarities in the ONS measurement technique.7
The telling measure is jobs which have increased by nearly 200,000 from the start of the pandemic. Now accounting for more than 4 million employee jobs, the health sector is second to retail as the biggest employers in the economy.
The story is very similar in public administration and defence, with virtually no workers furloughed and an increase in jobs of 60,000 over the pandemic.
In education furlough was up to 10% at the peak of the pandemic, but is now down to 3%. While we might expect an increase in jobs because of increased pressures, instead jobs are up only 14,000 (or 0.4%) on a total of 3 million.
Annex: Summary of figures by industry
Read all the issues in the Jobs and Recession series
Related reports:
-
Jobs and Recovery Monitor - issue 1
-
Jobs and Recovery Monitor - BME workers - issue 3
-
Jobs and Recovery Monitor - Regions - issue 4
-
Jobs and Recovery Monitor - update on young workers - Issue 5
-
Jobs and Recovery Monitor - Gender - Issue 6
Stay Updated
Want to hear about our latest news and blogs?
Sign up now to get it straight to your inbox