Jobs and Recovery Monitor - Regions
In our latest jobs and recovery monitor we look at headline labour market data covering September to November 2020, when new national restrictions had been introduced and furlough extended. We also look at the emerging picture across the regions and nations of the UK.
Over this period, we continued to see record redundancies and the UK unemployment rate rose to 5 per cent for the first time since 2016. All regions and nations have seen an impact on jobs, but London appears to have experienced the largest impact to date, with its unemployment rate reaching 6.9 per cent, and based on PAYE and workforce jobs data, accounting for around a quarter of the falls in jobs.
It is important to remember the labour market impacts of the crisis are still emerging and we are yet to see official data that covers the end of 2020 and into 2021 as national lockdown resumed and furloughed was extended. We also know there are discrepancies in the headline measure of employment between the labour market statistics and other sources such as the HMRC PAYE data[1].
Download full analysis (PDF)
Labour market headlines – redundancies and unemployment continue to rise.
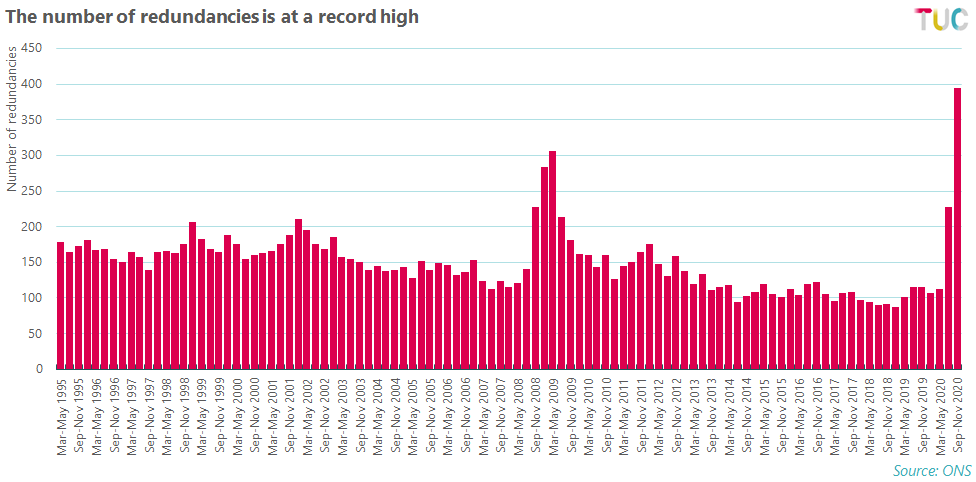
Latest labour market data shows another record rise in redundancies, increasing by 243 per cent on the year to just under 400,000 for the period September – November 2020, much higher than any comparable period during the financial crisis of 2008/09.
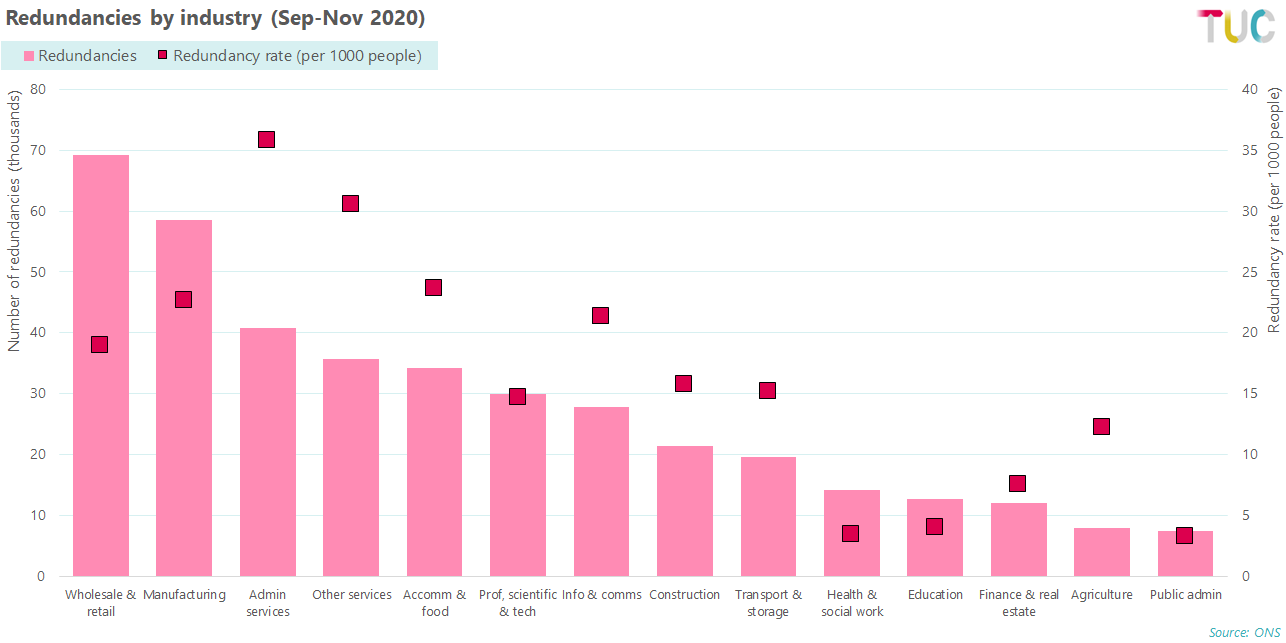
Three industries account for nearly 43 per cent of redundancies; wholesale and retail (69,000), manufacturing (59,000) and admin and support services (41,000). Admin and support services also has the highest redundancy rate (the number of redundancies per 1000 people) at 35.8 per cent.
Regional impact
Unemployment
The unemployment rate is now at 5 per cent, rising 13.3 per cent on the quarter, the biggest quarterly rise since 1980, leaving 1.72 million people unemployed.
The impact of the crisis is being felt across the regions and nations of the UK, with five regions (the North East, Yorkshire & Humber, East and West Midlands and London) seeing an unemployment rates of 5 per cent or more.
However, London appears to have experienced the most significant downturn in its labour market so far, seeing its unemployment rate increase 1.7 ppt on the previous quarter and 2.6 ppt on the year, to 6.9 per cent.
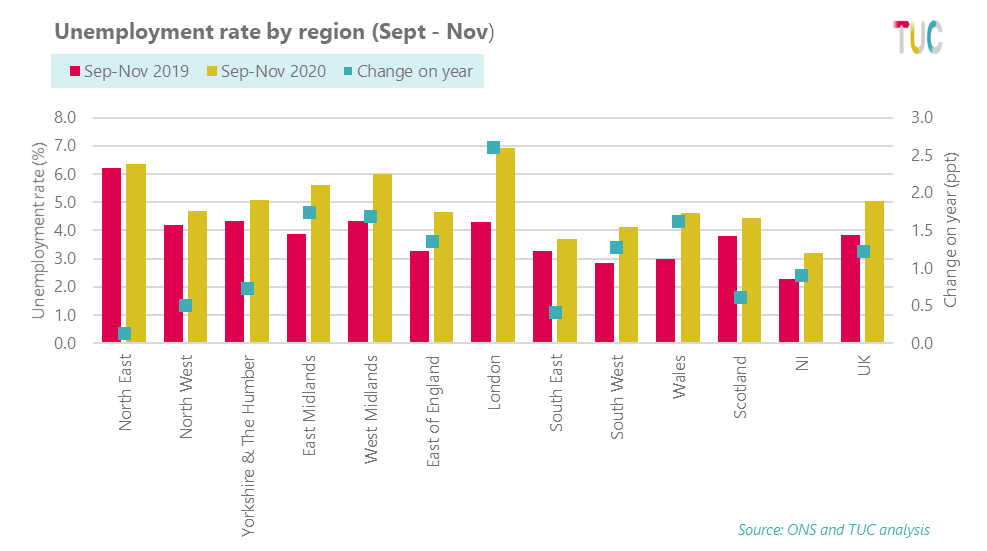
While some regions and nations have seen a small decline in unemployment on the quarter (June to August 2020), all have seen an increase on the same period a year ago (September to November). The North East has seen the smallest increase in their unemployment rate, but it is important to remember that the North East had a much higher unemployment rate than the UK average going into this crisis (6.2 per cent versus 3.8 per cent).
Redundancies
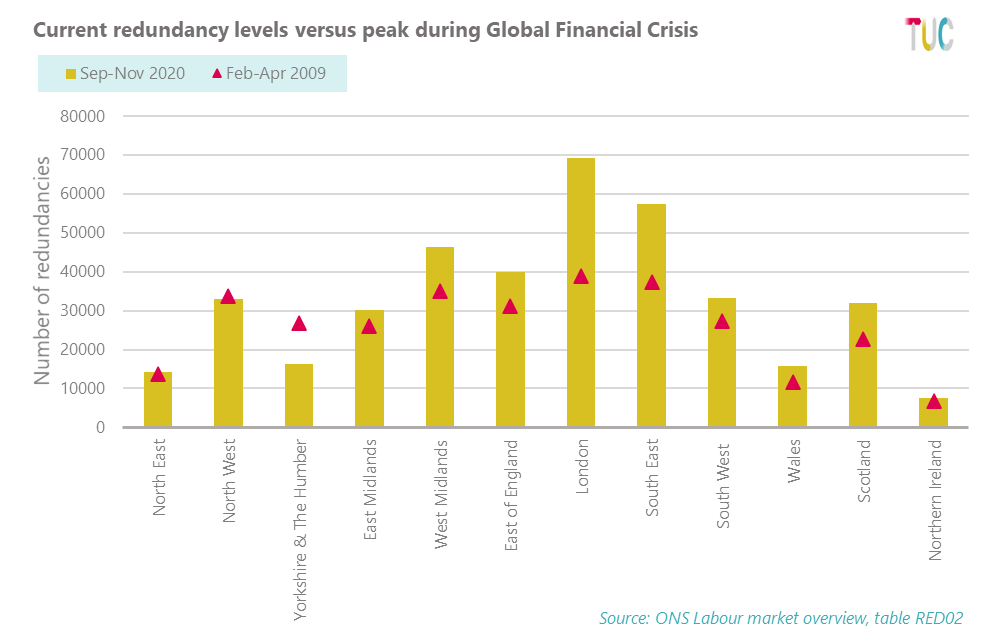
As noted, redundancies have reached a record high, and are higher than any comparable period during the financial crisis. This is echoed in regional and national redundancy data, with nearly all parts of the UK experiencing redundancy levels similar or higher than the redundancy peak of the financial crisis. [1]
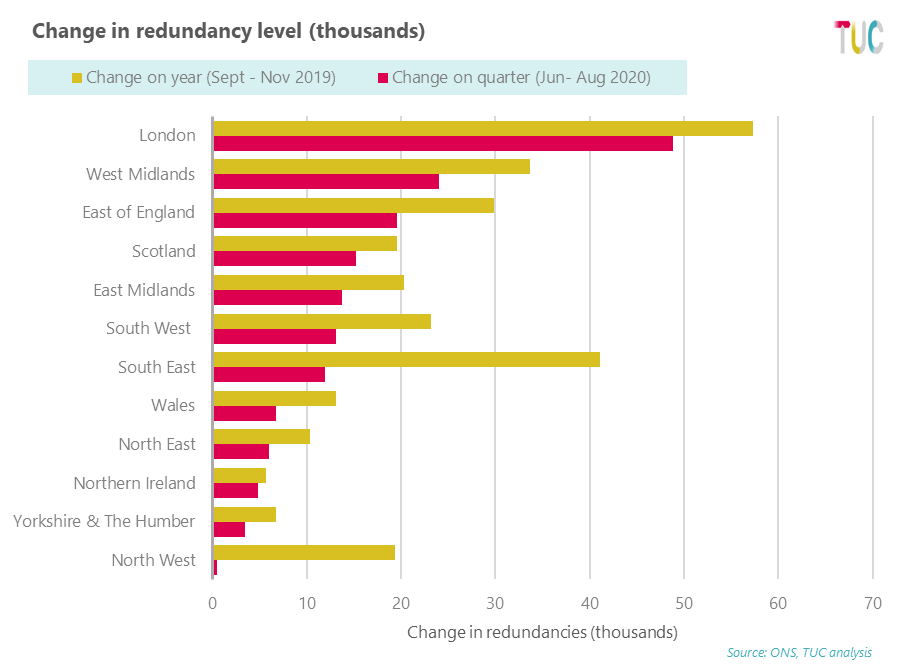
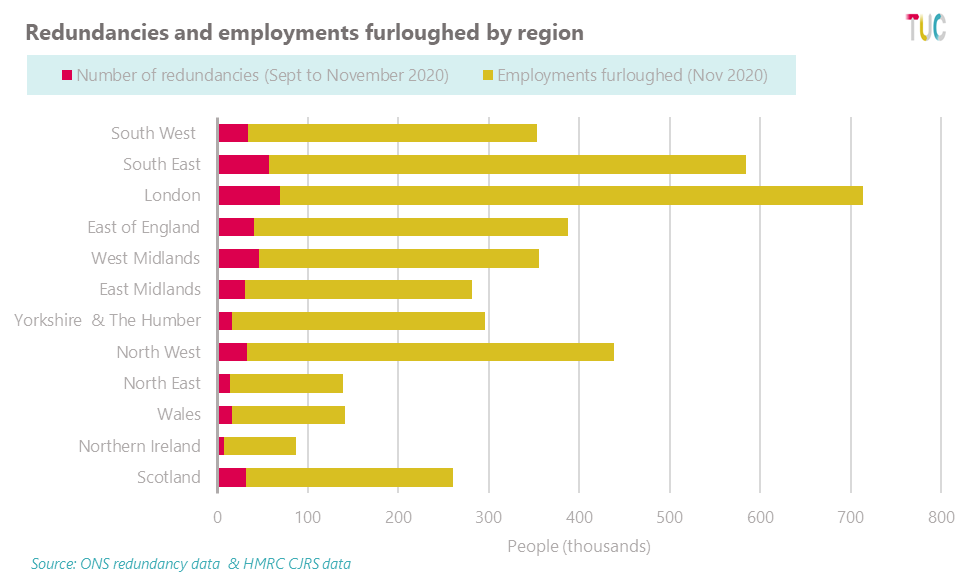
London has seen the largest increase in redundancies on the quarter and the year, up by 49,000 and 57,000 respectively, followed by the West Midlands which saw redundancies rise by 24,000 on the quarter and 34,000 on the year.
The South East has seen a relatively lower increase in redundancies on the quarter (12,000) but has seen them rise by 41,000 on the year. Similarly, the North West has seen redundancies rise by 19,000 on the year, but significantly less on the quarter (1000), suggesting that the impact of the crisis on jobs has so far hit different parts of the country at different times.
Workforce jobs and PAYE
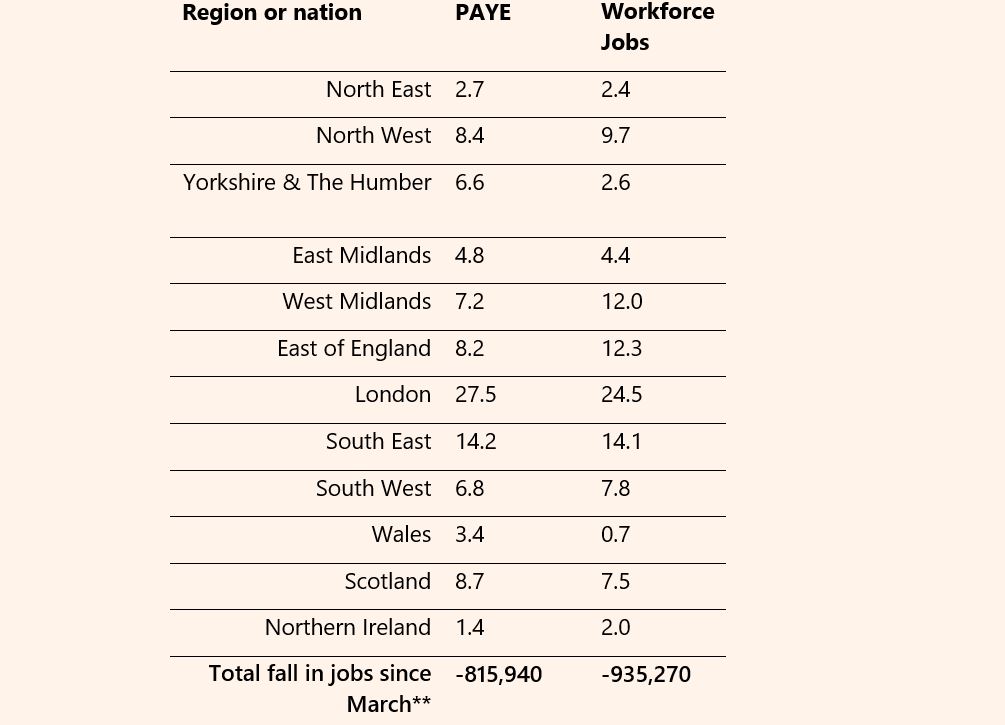
There are some discrepancies between the different labour market indicators, particularly regarding employment and Labour Force Survey measurement of employees. Both the workforce jobs data (which includes employees, self-employed workers and second jobs) and the PAYE data suggest a higher level of job losses than the Office for National Statistics (ONS) data suggests (see table 1, p5).
As both the workforce jobs and PAYE data show broadly similar scale and trends, we have used this data to get a more detailed indication of what may be happening at regional and industry level.
However, while there is some difference between the ONS redundancy data and workforce jobs data in terms of the scale of jobs losses, the workforce jobs data for the first three quarters of 2020 (to September) does show a similar trend to official redundancy data regarding the different timings of the impact of the crisis on jobs so far.
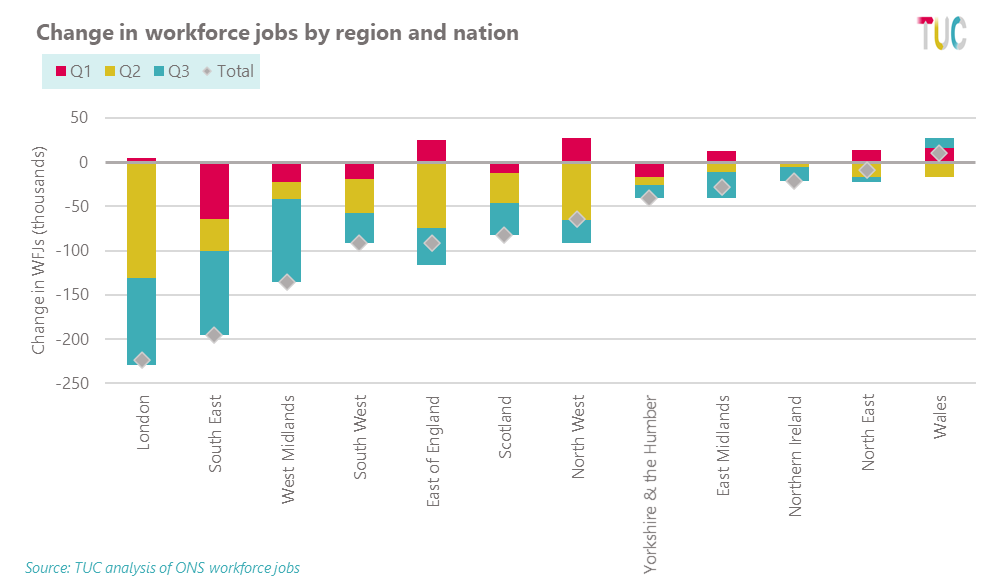
London, the East of England, and the North West appear to have taken a larger hit on job losses in quarter two of 2020 (Apr – June). Whereas the South East, and both the West and East Midlands saw a higher proportion of their total fall in jobs come in quarter three (July – September) - though London also saw significant job losses in quarter three too.
Industry
Both the workforce jobs data (which includes employees, self-employed workers and second jobs) and the PAYE data indicate that London accounts for around a quarter of the job losses so far, followed by the South East (14 per cent), and the East of England and the West Midlands (both between around 8 and 12 per cent).
Table 1: Share (%) of falls in employees and jobs by region, PAYE and workforce jobs data.
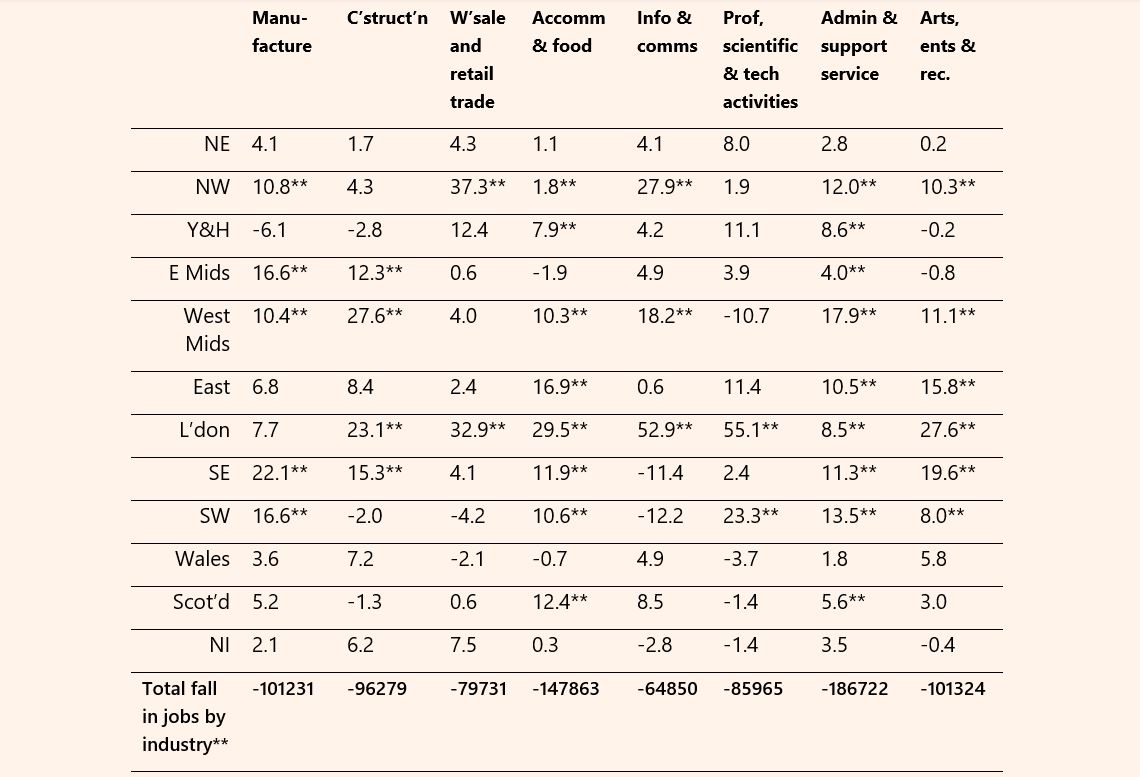
At UK industry level, workforce jobs data shows the main falls in jobs between March 2020 and September 2020 have occurred in administrative and support services (187,000), accommodation and food (147,000), arts and recreation, and manufacturing (both around 101,000).
As the table below shows, the bulk of job losses in accommodation and food and in the arts, entertainment and recreation industries have been concentrated in London, which accounts for 29.5 per cent and 27 per cent of the decline in number of workforce jobs in those industries.
Conversely job losses in manufacturing have been more heavily concentrated in the South East and West and East Midlands. Declines in the number of jobs in wholesale and retail have particularly affected the North West, which accounts for 37 per cent of the fall in workforce jobs and falls in administrative and support service jobs have hit the West Midlands particularly hard.
Table 2: Share (%) of industry falls in number of jobs by region or nation, workforce jobs (March – September 2020)
GDP
The overall picture in jobs terms, is that the crisis has impacted London to a greater extent than other parts of the country so far. This contrasts with the latest regional GDP figures for quarter one and quarter two of 2020, which suggests that London’s economic output has been somewhat more insulated from the crisis than other parts of the country.
In total London’s economy declined by around 18 per cent in the first two quarters of the year, whereas the UK overall saw a decline of nearly 22 per cent. Most other regions and nations saw similar declines to the national average, with exceptions being Wales which saw a decline of 17 per cent, and the West Midlands which saw its economy decline by over 25 per cent.
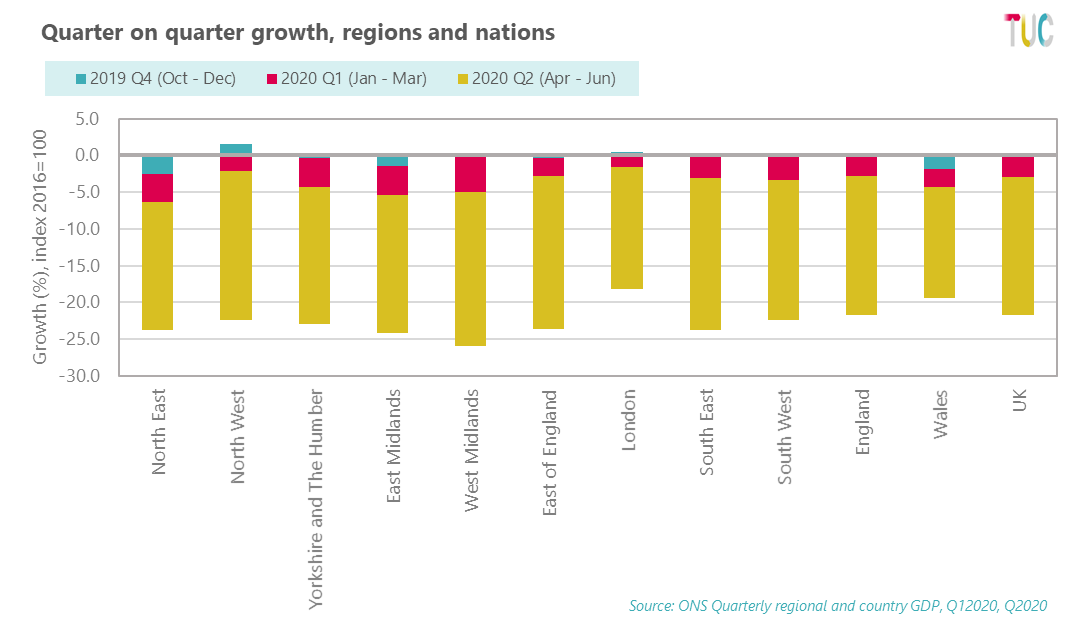
However, as the above chart shows, apart from the North West, London and South West, most other parts of the country had experienced negative growth at the end of 2019, meaning they were already in a technical recession[1] before the onset of the pandemic and its economic impact.
It is likely that the reason London has seen a lesser impact on GDP (albeit still large) is because of the importance of industries like finance to its economy.
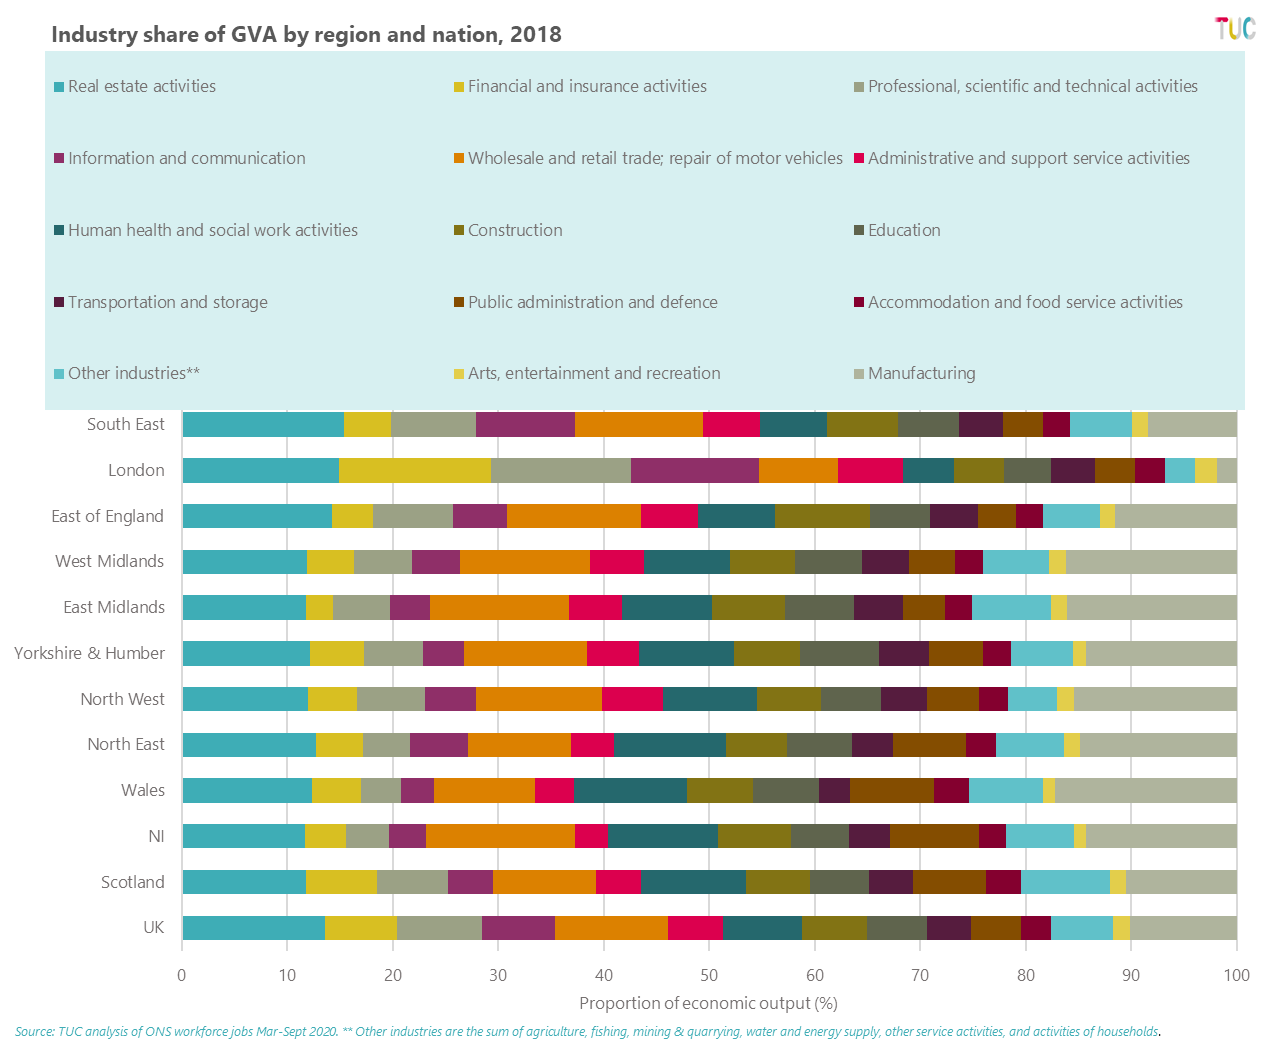
As the chart below shows, Finance and insurance (14 per cent), professional, scientific and technical activities (13 per cent) and information and communication (12 per cent) account for nearly 40 per cent of London’s economic output respectively, compared to around 22 per cent for the UK as a whole (yellow, grey and purple bars).
Conversely across the UK, manufacturing (light grey bar on the right of the chart) and wholesale and retail industries (orange bar), which have been significantly affected by necessary lockdown measures both account for around 11 per cent of the UKs output, whereas for London they contribute less at 2 per cent and 7.5 per cent respectively.
So, while the financial centre of London is supporting its economic output to some extent, many of the jobs that rely on people being physically located in the city – cafes, bars, hotels - have already been lost. But, though the extent of jobs losses in other parts of the country has not yet been as severe, many parts of the country were experiencing recession (and higher unemployment rates) before the pandemic hit.
Furlough
Latest faster indicator data from the ONS suggests that 18 per cent of employees are furloughed[1], following a national lockdown and extension of the furlough scheme to the end of April.
Regionally, we currently have data up to the end of December from HMRC, when the furlough rate was around 13 per cent (around 3.8 million employments furloughed). Between the eleventh-hour furlough extension on the 31st of October and the end of December, most regions and nations saw the number of furloughed employments increase by at least 50 per cent, with the South East, South West, North East, East Midlands and East of England seeing increases of over 70 per cent, following national lockdown being reintroduced in November.
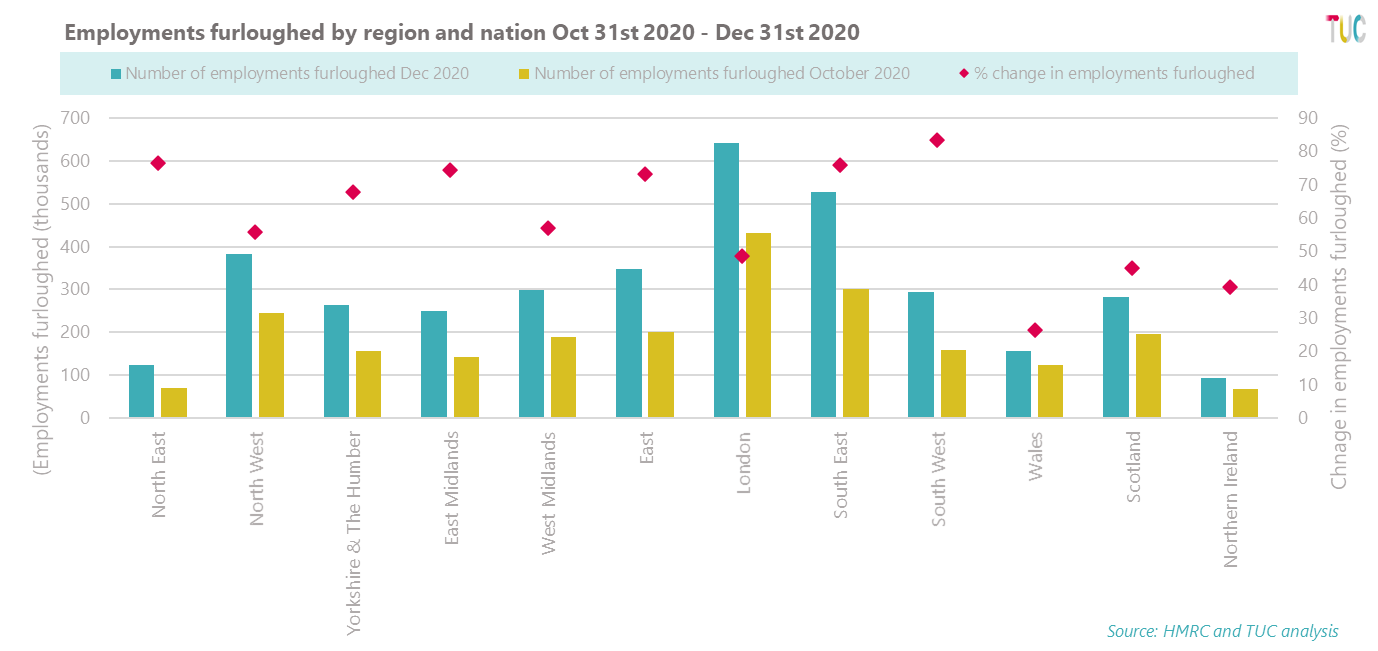
As the chart below shows, furlough continues to play an important role in supporting businesses and their workers across the UK. Without it the scale of jobs losses would doubtless be much worse. That is why it is vital the Chancellor agrees to extend the full furlough scheme until at least the end of 2021, to ensure that businesses and their employees have some certainty over the coming year.
A worker’s budget
At next month’s budget, the Chancellor has the opportunity to make the commitments and investments needed to protect and create work and ensure a better recovery for all regions and nations of the UK. You can read our full budget submission here and our latest report on the importance of voice and place in achieving a just transition to a green economy here.
As well as extending furlough until the end of 2021, the government must get serious about job creation.
This means investing in the green jobs we need to reach our net zero targets, investing in a public sector jobs drive, and engaging in National, regional and sectoral recovery councils with businesses and unions to ensure recovery from this crisis across the UK, and that longstanding talk of ‘levelling up’ is more than just a soundbite.
Read all the issues in the Jobs and Recession series
Related reports:
-
Jobs and Recovery Monitor - issue 1
-
Jobs and Recovery Monitor - BME workers - issue 3
-
Jobs and Recovery Monitor - Regions - issue 4
-
Jobs and Recovery Monitor - update on young workers - Issue 5
[1] For discussion on why this might be happening see Office for National Statistics, Leaker, D, 29th January 2021, https://blog.ons.gov.uk/2021/01/29/painting-the-full-picture-what-our-statistics-tell-us-about-the-labour-market/ and O’Connor, M and Portes, J, 14th January 2021, https://www.escoe.ac.uk/estimating-the-uk-population-during-the-pandemic/
[2] Note: In this instance, rather than comparing growth or change overtime, we are comparing current levels of redundancy versus the peak of financial crisis on record, where total redundancies reached 311,000 in Feb-Apr 2009.
[3] A technical recession is when two consecutive quarters of negative growth are recorded.
Stay Updated
Want to hear about our latest news and blogs?
Sign up now to get it straight to your inbox