
Wage growth, but only for the few
In recent months, headline figure for wages have hit post-crisis records. But there is growing evidence – from industry figures, facts on euro-millionaire bankers, and the consequent distributional effects – that pay gains are for the few. Reeling from the most severe pay crisis for 200 years, the many have little reason to celebrate.
Pay growth in finance
Headline pay has risen to a post-crisis high of 3.4% over the past three months, up from 2.6% a year ago (and still far from a big deal given the pre-crisis average was 4.0%). But over the year the stand-out movement has been a near doubling of pay growth in ‘finance and business’ (from 2.3% in January 2018 to 4.3% in Jan 2019). A surge in construction pay has retreated a little (orange in the graph below); manufacturing pay (yellow) has steadily declined; pay in distribution, hotels and restaurants (purple) is slowing. The public sector also gained over 2018, but only modestly.
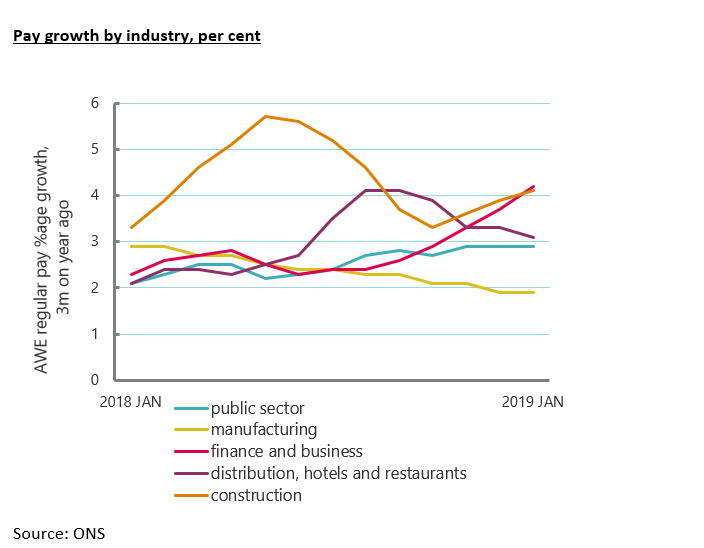
It is likely that weaker pay across most industries echoes the weaker economy indicated by the GDP figures, and the global weakness that is alarming the OECD. In the UK, manufacturing is all but in recession. Construction growth has slowed sharply and service industry growth is very sluggish relative to historic norms.
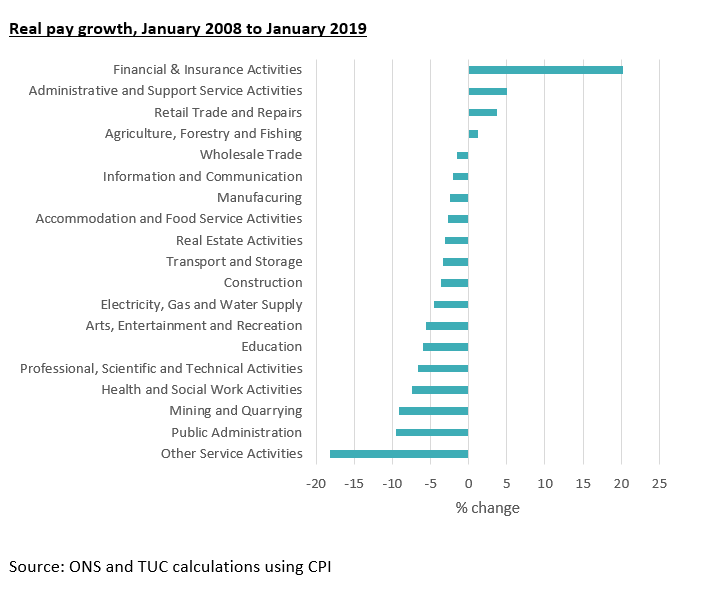
Moreover, pay growth over the past year is simply an extension of trends since the crisis. Real term pay growth across the decade is shown on the next chart. ‘Finance and insurance activities’ vastly outstrip the rest of the economy. Only three other industries have pay above the pre-crisis position, and only just. Echoing the most severe pay crisis for two centuries, real pay in the 15 other industry groupings is still well below pre-crisis level. Excluding finance and insurance, industry pay declined by approximately 3% over the decade.
Euro-millionaire bankers
These trends in financial sector pay were echoed by last week’s figures on millionaire bankers, published by the European Banking Authority. The latest figures correspond to the ‘end of 2017’ and show counts by country of “high earners earning EUR 1 million or more per financial year”.
These confirm high times continuing in the UK financial sector. At the end of 2017 there were 3,567 euro-millionaire bankers in the UK. While languishing in international comparisons of real wages, the UK is top of the league table of euro-millionaire bankers by a mile. Germany is in second place, with 390.
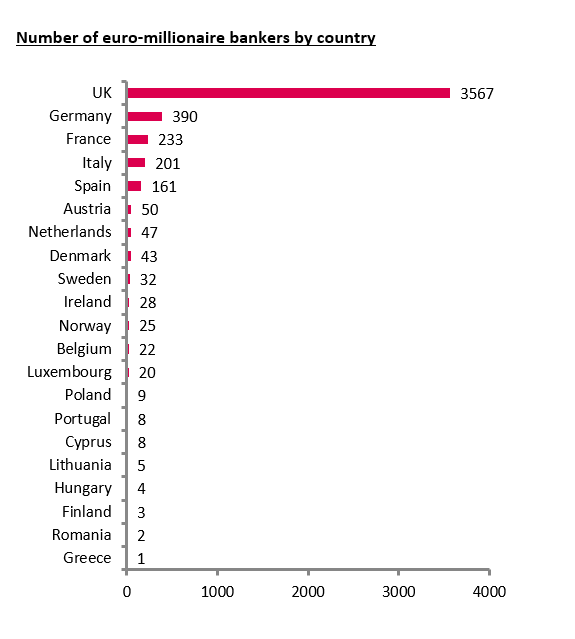
Excluding the UK there are 1,292 euro-millionaire bankers in the rest of Europe. So there are almost three times as many euro-millionaire bankers in the UK than the rest of Europe put together.
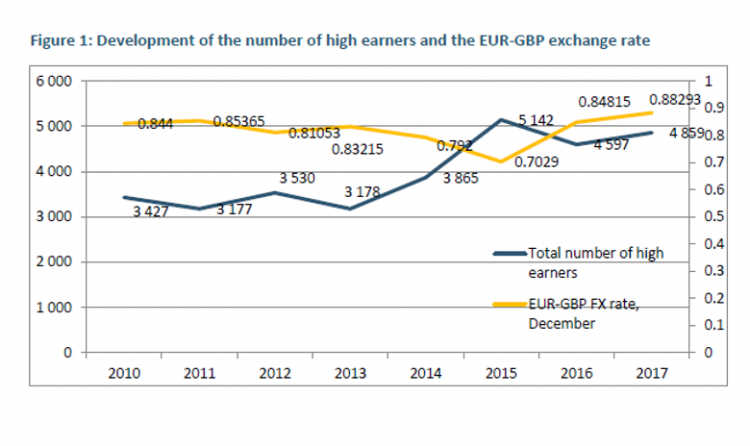
And this is despite challenging conditions, with weak sterling meaning more pounds are needed to qualify as a euro-millionaire. In December 2015, £725K was needed. After the referendum, this rose to £820K in December 2016 and then further to £875K December 2017. While the UK figure for 2017 is up slightly on 3,529 in 2016, it is still 566 short of the record figure of 4,133 in 2015.
These UK-specific factors are enough to dictate overall trends: the record year for euro-millionaire bankers in all of Europe was 2015, as on the EBA’s own chart below. But the big picture is the hefty increase over the latest three years compared to 2010-2013. In the UK there are high times at the top end.
Distributional analysis
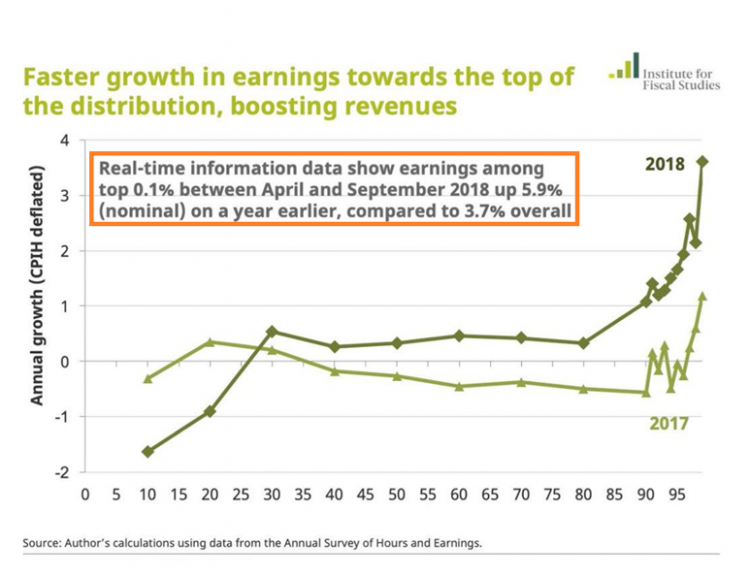
This action in the finance sector resonates with commentary on the income distribution in the aftermath of the spring statement, with the Office for Budget Responsibility (OBR) and the Institute for Fiscal Studies (IFS) drawing attention to sharp pay rises for the highest earners. The IFS chart below shows real pay growth across the income distribution in the years to April 2017 and April 2018. Taken together there is barely any pay increase for 90 per cent of the population and pay declines for the lowest earners. But within the top 10 per cent of earners, pay growth rapidly accelerates as pay gets higher.
The figures are based on the annual survey of hours and earnings which takes a reading in April, so the pattern may have changed in the rest of 2018. But the IFS also cites (in the orange box) the OBR finding showing high-end pay growth continuing beyond April: between April and September 2018 earnings were growing by 5.9 per cent – while they give a figure of 3.7% 'overall', what is needed is a figure excluding the high earners.
Pay and the economy
Every month, excitement grows about new pay records. But evidence suggests only those at the top end are winning. Outside the top end, slowing or sluggish pay is more in tune with the wider economy.
And there is a double whammy. The gains for the few stand in the way of the policy action that would relieve the hardship of the many.
Policymakers take wage inflation at face value as showing capacity constraints in the economy beginning to bite. Interest rates are not cut, and public spending is held back. No action is taken when the reality is the weakest growth for a decade and the dangers from the chaos around Brexit.
Some might worry about an exodus of millionaire bankers after Brexit. But there is in the EBA figures a vivid illustration of the grotesque imbalances that help explain the vote and – worse – may still stand in the way of change for the many.
Stay Updated
Want to hear about our latest news and blogs?
Sign up now to get it straight to your inbox
