17-year wage squeeze the worst in two hundred years
A decade on from the financial crisis, real wages today are still worth £24 a week less than they were in 2008. By the time they're forecast to return to their pre-crash level in 2025, real wages will have been in decline for 17 years - the longest period since the beginning of the nineteenth century.
The TUC compared the current wage squeeze (including the forecast) with every major earnings crisis over the past two centuries.
We found that the only slump longer than the one we're experiencing today was the 24 years between 1798 and 1822, a period when Europe was ravaged by the Napoleonic Wars and their aftermath.
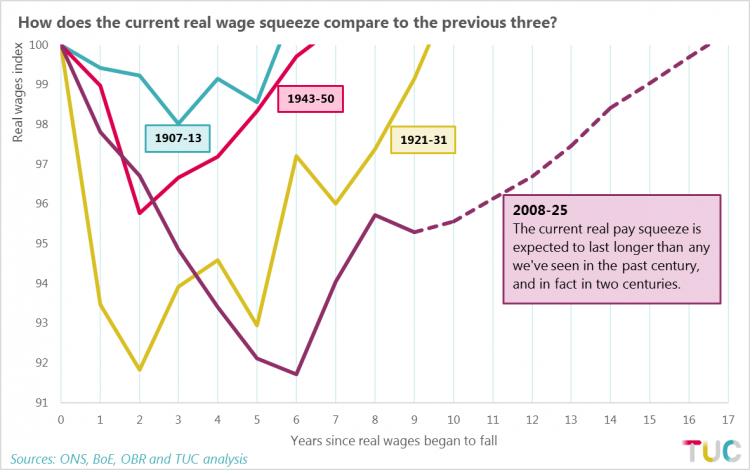
In fact, real wages even recovered faster during the Great Depression (10 years) and after the Second World War (7 years), as the chart below shows:
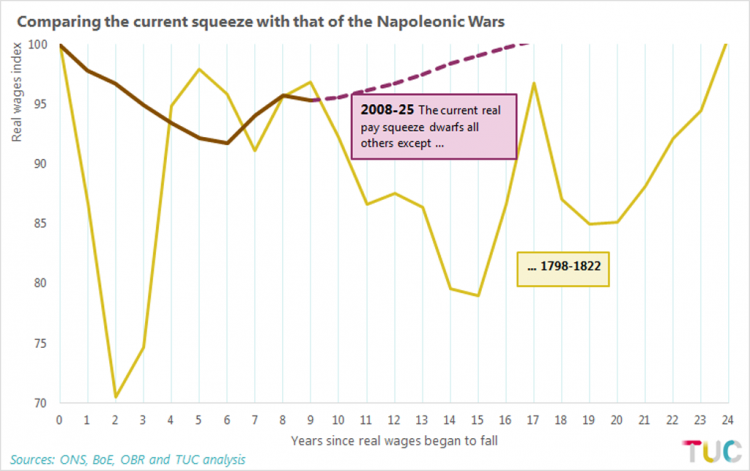
The current crisis not only dwarfs all others during the last century; it is the biggest since the period between 1798, when Nelson destroyed the French Fleet at the Battle of the Nile, and 1822, when the economy finally began to recover from the devastation of the Napoleonic Wars:
Our analysis includes an assessment of the scale of each earnings crisis in cash terms, so that a short and deep crisis can be compared to a longer but shallower one.
The measure captures the earnings workers missed out on against a scenario where wages kept pace with inflation through each crisis. Geometrically these correspond to the area under a ‘real wages unchanged’ line, i.e. the line across the top at 100.
The calculation is set in the prices of a specific year, as is conventional for assessments of changes in real wages – we use today’s prices, i.e. 2018.
As a result of pay not keeping pace with the cost of living, we estimate that by 2025 the average worker will have lost out on around £18,500 in real earnings.
The full results for both the duration and length of all the real wage crises are shown on the chart below. The severity of the present crisis relative to all others is striking:
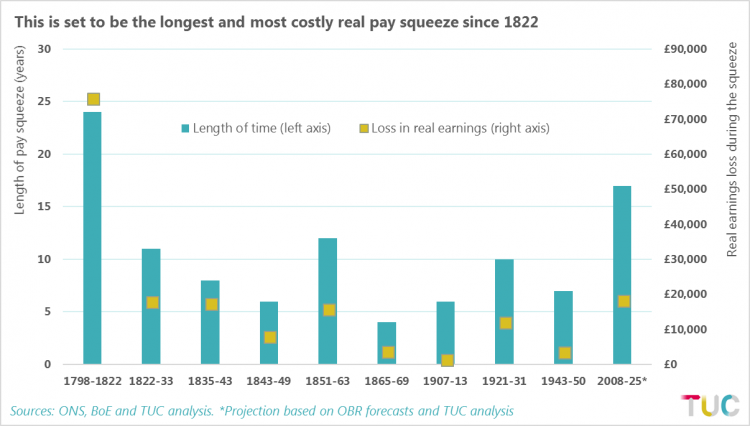
These cash figures are indicative only - plainly earnings at the start of the nineteenth century were very far removed from anything that would permit a loss of the scale of £75,000.
They can however be thought of as showing what the lost earnings in the present crisis would have been had it evolved as it did over the Napoleonic Wars or during the Great Depression etc.
Note that if all crises were not scaled in this way, the lost earning over the present crisis would dwarf everything else, because the economy and earnings are so much bigger relative to 1798.
Thousands to march in London
The analysis is published as tens of thousands of people prepare to march through London on Saturday 12 May in support of the TUC’s call for a ‘New Deal for Working People’.
The wage crisis is not natural or inevitable. It grew out of the global financial crisis but has been made significantly worse by self-defeating austerity policies, the rise of insecure work and the decline in collective bargaining across the UK.
The fact that we have to go back two centuries to find other comparable episodes shows just how unusual this crisis is, and how inadequate the political response has been. Workers are paying a very heavy price.
We need only need austerity to end immediately, but also to be reversed. Public infrastructure and spending on public services must be expanded. Above all, workers in the public and private sector desperately need a pay rise.
Methodology
(i) figures for 2018-2025 are based on the OBR forecast to 2022 and then a projection to 2025 using the average forecast growth rate over 2018-2022
(ii) the £24 cash figure in the opening paragraph is derived using annual the AWE for total pay (rather than excluding bonuses) adjusted with CPI (rather than CPIH)
(iii) these figures are used to permit comparisons with long-run back data published by the Bank of England – see their a millennium of macroeconomic data.
Stay Updated
Want to hear about our latest news and blogs?
Sign up now to get it straight to your inbox