
GDP - is growth evaporating?
The latest monthly GDP figures make for grim reading.
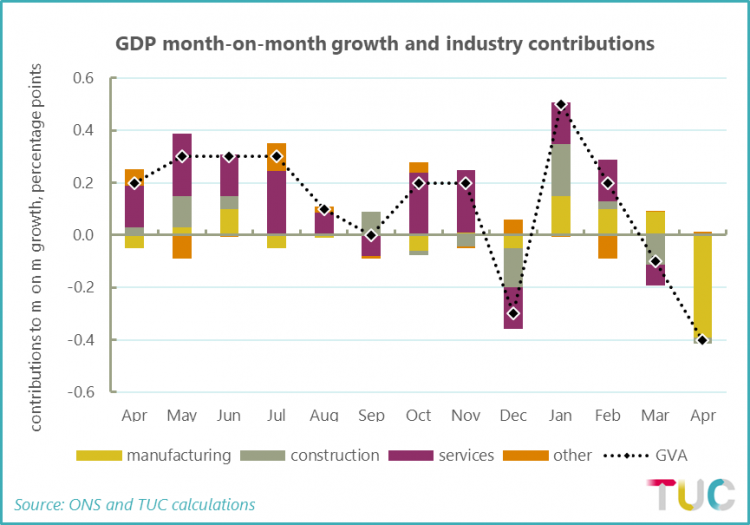
The quarterly growth into April was 0.3 per cent, down from 0.5 per cent in March. Monthly GDP figures suggest a decline of 0.4% into April, following a decline of 0.1% in March.
Monthly figures are notoriously erratic and some of the change might be a one-off, but the overall picture is of growth evaporating across the board. The chart below of contributions to GDP growth shows even the service sector seemingly grinding to a halt.
Manufacturing
The biggest decline is in the manufacturing sector (the yellow column). Accounting for the whole of the GVA decline on the month, manufacturing actually fell by 3.9%. In month-on-month terms this is the largest decline since 2002, when the figures were distorted by factory shutdowns over the Queens Golden Jubilee celebrations.
Accounting for half of manufacturing’s monthly decline is motor vehicle production:
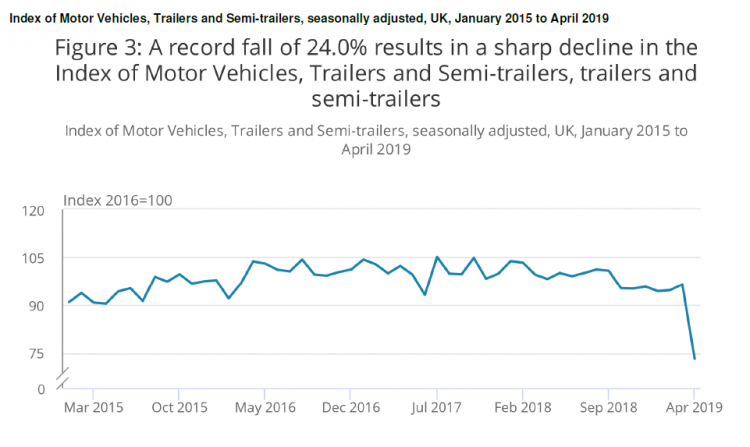
ONS see the figures driven by shutdowns and wider demand weakness:
“…the dramatic fall in car production, with uncertainty ahead of the UK’s original EU departure date leading to planned shutdowns...weak domestic sales and a gradual decline in export sales in this industry, since a peak in October … with anecdotal evidence from respondents confirming weakening domestic and global demand."
The shutdown means that some of the decline is temporary. But there are wider factors in play.
Last week, Ford announced that it would shut its factory in Bridgend, South Wales, by 2020, with the loss of 1,700 jobs.
This comes hard on the heels of Honda’s plans to close its Swindon car plant and Nissan’s decision to pull several vehicles for its Sunderland factory.
There are also widespread declines outside the transport sector, as the ONS observe:
“Within manufacturing there is widespread weakness, with 11 of the 13 subsectors falling, as the boost from the early completion of orders ahead of the UK’s original departure date has faded”.
Sectors particular badly affected include:
“pharmaceutical products, which fell by 8.7%, following export-driven strength during March 2019 basic metals and metal products, which fell by 4.1%, and chemicals and chemical products, which fell by 5.9%, the largest fall since January 1979.”
Services
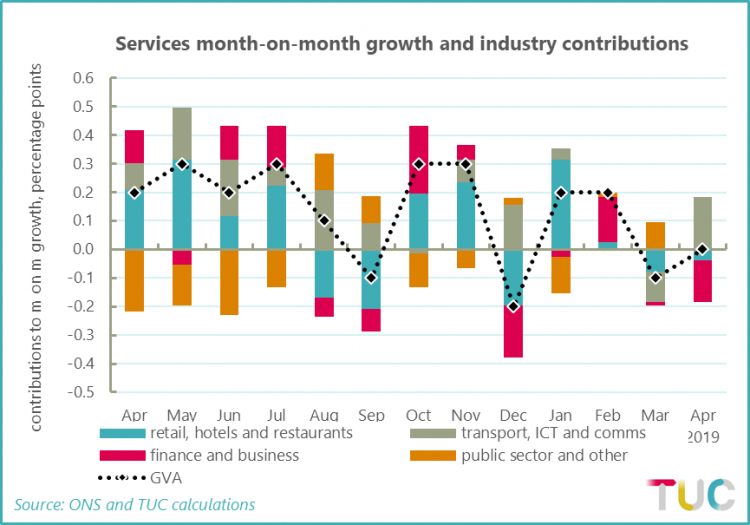
As the opening chart shows, service sector growth is also slowing.
Quarterly growth into April was 0.2 per cent, the lowest reading for a year.
Again, the monthly industry figures suggest a worrying evaporation of growth.
Over most of 2018 most industry categories were contributing positively to monthly growth.
The exception, of course, those industries dominated by the public sector (orange) and still victim to ongoing government cuts.
But into 2019 the dominant finance and business (crimson) category has been negative most months and even the usually robust retailing category has reversed.
These monthly data are a relatively new innovation, so monthly movements should be treated with some caution.
And as the chart above shows, negatives are often followed by positives. But the weaker position across most service industries is increasingly clear. The sum of the parts must be real concern for the strength of economic activity.
Part of this reflects wider global concerns, and part reflects uncertainties associated with Brexit.
Either way, someone needs to get a grip.
Stay Updated
Want to hear about our latest news and blogs?
Sign up now to get it straight to your inbox