Don’t get too excited about the latest productivity figures, we’re in the worst decade of growth for two centuries
Looked at over a longer period we’ve had the worst decade for productivity in two centuries. And there’ll be no decisive improvement without far more substantial policy change.
We begin with the Treasury’s comments from last Friday, when the latest figures were issued.
Their boast follows from an uptick in the quarterly growth of output per hour, which has been strong for two quarters in a row – Q3 2017 at 1% and Q4 at 0.7%.
Productivity, quarterly growth
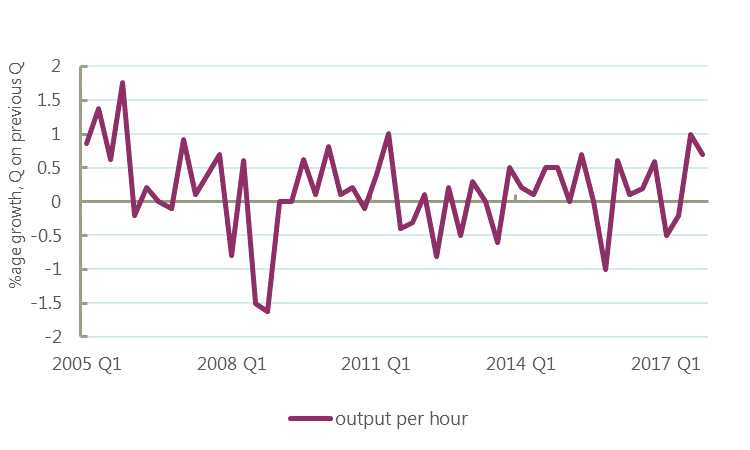
Half-yearly growth comparing the second and first half of 2018 was 1.2%: as the Treasury say, the strongest figure since the financial crisis (since 2005 in fact).
Let’s explore this.
1. Higher productivity is the result of levelling down
In general terms, the UK economy is currently on a negative trajectory:
- GDP growth is weak; on an annual basis, the weakest for 5 years
- employment growth has slowed and
- hours worked have declined (though the extent of the decline may be erratic)
So the only reason that the productivity figure has improved is because the fall in hours (and jobs) growth is worse than the slow down in output growth.
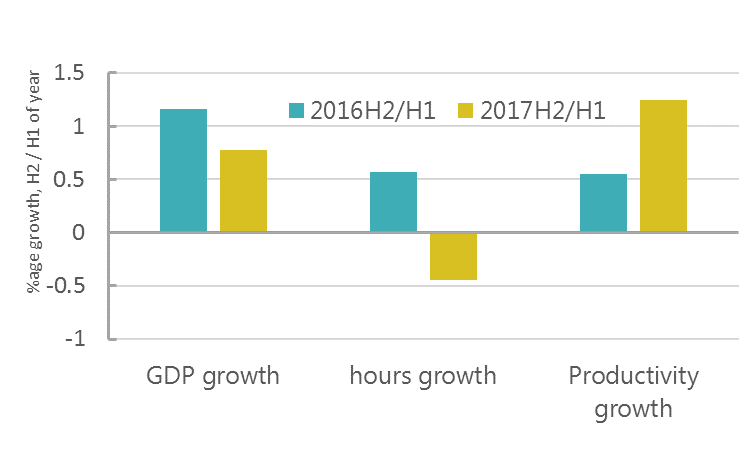
To illustrate: looking at the half yearly figures (on which the Treasury claim is based) we can compare the latest figure with the corresponding figure from a year ago (illustrated below). Half yearly GDP growth slowed to 0.8% in the second half of 2017, when it was 1.2% in the second half of 2016. Hours are now in decline by -0.4%, when in the second half of 2016 they rose by 0.6%. So, productivity rises to 1.2% from 0.5%. But this is the worst possible way for productivity to improve. Crudely you can think about it like this: we haven’t even been able to produce more for less. We’ve produced less, and worked slightly fewer hours to do so.
GDP growth minus hours growth equals productivity growth
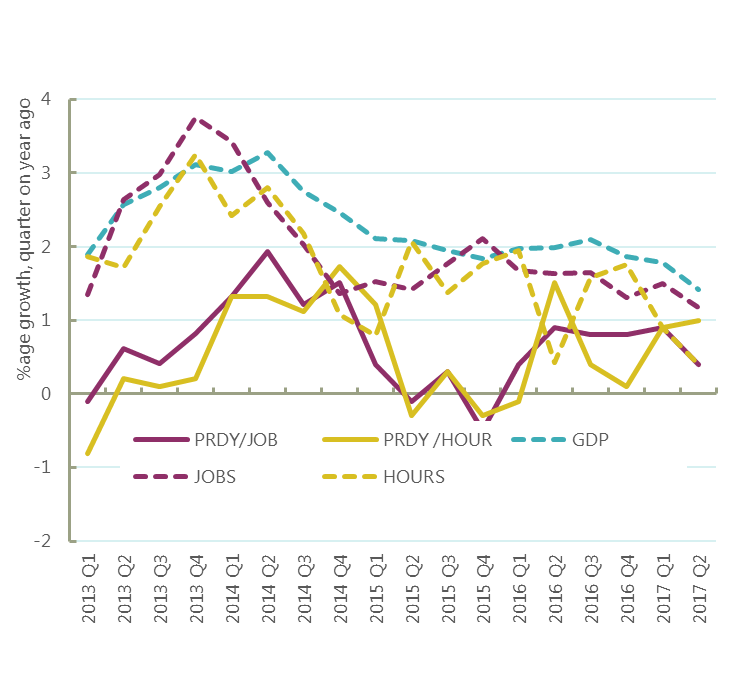
More generally, quarterly and half-yearly figures are volatile and erratic. Four quarter growth figures are more (but not completely) stable. Here productivity growth (the solid lines on the graph below) on both hours and jobs measures over 2017 is shown growing broadly between 0 and 1 per cent, up a little on a (dire) 2016, but very far from a strong performance. Moreover the levelling down is plainly apparent – with GDP, hours and jobs growth (the dotted lines) all slowing steadily since 2014.
Productivity, jobs, hours and GDP
2. The big picture is still of unprecedented weakness
The chart below makes it obvious that recent outcomes are still very weak. For calendar year 2017, output per hour growth was 0.7%. Before the financial crisis, there were only 5 years when productivity growth was weaker, and all but one of these (1984) were associated with recessions. The average annual growth ahead of the crisis was 2.2%; since the crisis average annual growth in the decade to 2017 has been only 0.2%.
Productivity per hour, annual growth
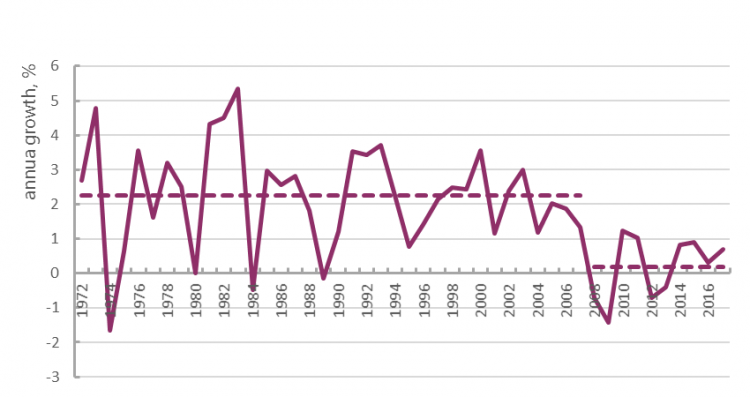
3. Any post-crash productivity revival ended when austerity began
On the above chart, the strongest year for productivity was 2010 as the economy emerged from the financial crisis. Since austerity policies were implemented, productivity growth evaporated and has been in the doldrums ever since. I have discussed this extensively see e.g. here.
4. Any investment in infrastructure does not improve upon the last parliament or push the UK up the international league.
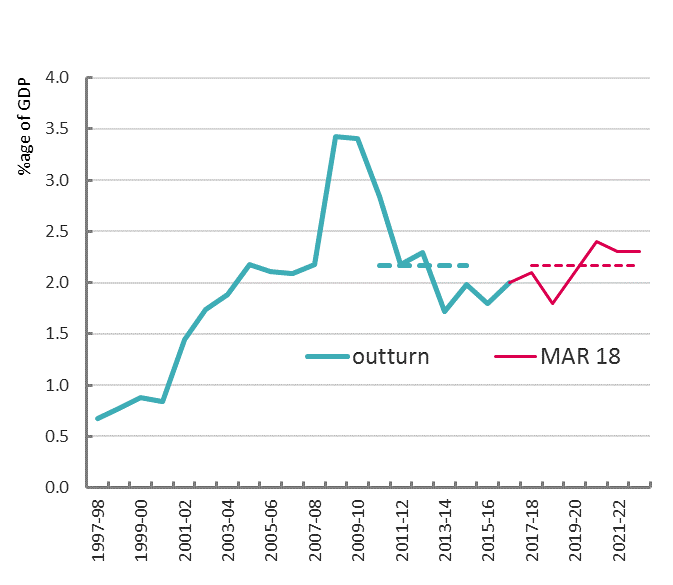
We agree with the sentiment of the second part of the Treasury statement, that investment and skills will boost productivity in the long run. But the rhetoric falls well short of the reality of what the government is actually doing. Office for Budgetary Responsibility (OBR) figures show public sector net investment at 2.2% of GDP over the current parliament – the same as under the very low bar of the first parliament of austerity.
Public sector net investment as share of GDP
On the internationally comparable (national accounts) measure of public investment, average spending across the OECD is 3.5% of GDP (for 2016, the most recent year where full data are available). The UK figure was only 2.6% of GDP, 8th from the bottom of advanced countries.
Public investment, % GDP
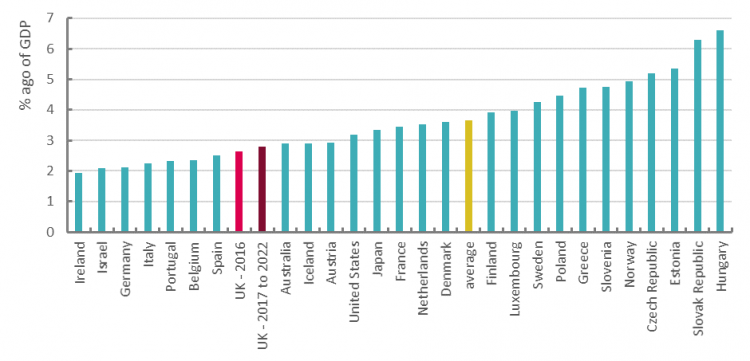
The Treasury’s latest plans will up this just a notch to 2.9% of GDP in 2020 and 2021, and it’s back down to 2.8% in 2022.
While the Treasury describe these as ‘long-term’ plans, the OBR justly described any boost to growth as ‘modest’.
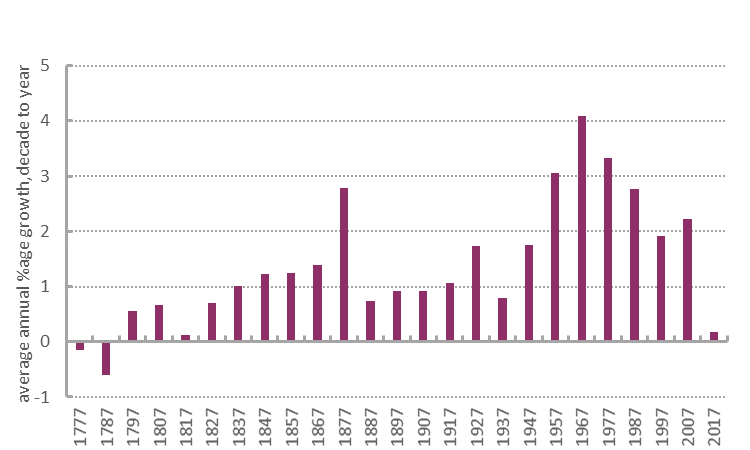
5. The worst decade for productivity for two centuries
In the decade to 2017 UK productivity grew by only 0.2% a year. Using Bank of England historical data, this is the lowest productivity growth figure since the decade to 1817.
Decade productivity growth
A failed economic strategy
In short, there is nothing to boast about in the latest productivity figures.
Just as the Treasury seek to take credit for an illusory improvement, they bear responsibility for a catastrophic decline.
Their austerity policies have led to a low-growth economy that has been good at creating bad jobs and low pay. Until this policy is reversed there will be no decisive improvement in productivity. Substantial and sustained increases in public investment, and higher not lower spending on public services and public sector pay will strengthen the economy and strengthen productivity and wages across the board. The productivity failure is a symptom of a failed economic strategy; it’s time to administer a new cure.
Stay Updated
Want to hear about our latest news and blogs?
Sign up now to get it straight to your inbox
