TUC Equality Audit 2022
This section looks at the degree to which different workers are represented in trade unions. It makes use of the most recent official statistics relating to trade union membership among women, BME, disabled and young workers.1
There is no official data for LGBT+ workers in union membership.
The figures show that women, Black/Black British, white, disabled and older workers are overrepresented in union membership while underrepresented are male workers, those from other ethnic minority groups, non-disabled workers and younger workers.
Women
Women employees are overrepresented in union membership. As chart 1 shows, in 2021 56.8 per cent of union members were women, despite accounting for 49.8 per cent of employees.
- 1 Trade Union Membership Statistics UK, May 2022, BEIS/ONS
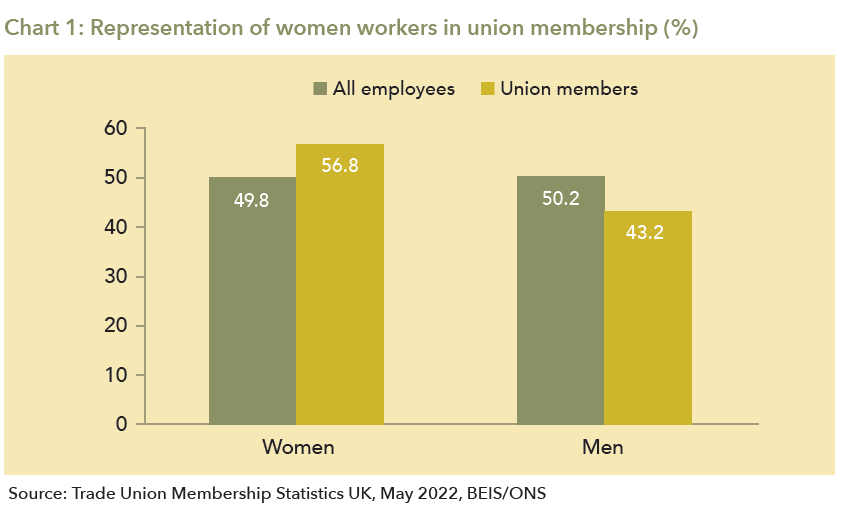
Since 2002, union density has been higher among women employees than men employees and in 2021 it was 26.3 per cent for women compared with 20.0 per cent for men.

In part the higher union density among women in the past two decades reflects higher female employment rates in the public sector, where union density is much greater. Over half (50.1 per cent) of public-sector employees are union members compared with just 12.8 per cent of private-sector employees. However, in the latest period (2020–21) union density among women overall fell slightly for the first time since the publication of the 2018 TUC Equality Audit. This was mostly because of a fall in union membership in the public sector.
Trade union density among women is highest for those in professional occupations. 46.8 per cent of women in professional occupations are union members compared with 23.3 per cent of men. Teachers, midwives and nurses are women-dominated professions that are highly unionised.
Meanwhile, 26.4 per cent of women in caring, leisure and other service occupations are union members, as are just 16.4 per cent of women in sales and customer service jobs and only 13.0 per cent of women in ‘elementary occupations’. In sectors such as caring, leisure, other service occupations and elementary occupations union density is significantly higher among men.
Women in some types of employment are underrepresented in union membership. Women are more likely than men to work part time (73 per cent of part-time workers are women2
) and part-time workers are underrepresented in trade unions. Those working part time form 23.6 per cent of employees but 21.8 per cent of union members.
Union density among women in temporary jobs is 17.5 per cent – substantially higher than the 12.1 per cent figure for men in temporary jobs. However, the level is still well below the 26.3 per cent among women employees overall, and women are more likely than men to be in temporary jobs (6.9 per cent compared with 5.1 per cent of men).
BME workers
BME employees overall are underrepresented in union membership. While they account for 13.3 per cent of all employees, they make up just 11.8 per cent of union members. In contrast, white workers form 86.7 per cent of the total employee population but 88.2 per cent of union membership.
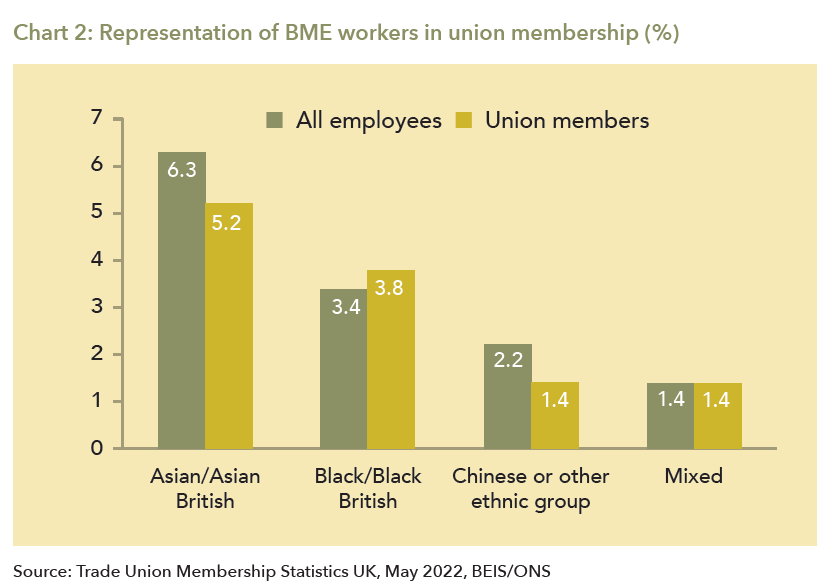
However, Black/Black British workers are slightly overrepresented among union members. They account for just 3.4 per cent of all employees but 3.8 per cent of union members. And employees from a mixed ethnic background are fairly represented – accounting for 1.4 per cent of both employees and union members.
But the largest BME group of employees – Asian or Asian British – account for only 5.2 per cent of union members despite forming 6.3 per cent of the employee population. Meanwhile, those identifying as Chinese or from another ethnic group constitute 2.2 per cent of the employee population but just 1.4 per cent of union members.
- 2 EMP01 SA: Full-time, part-time and temporary workers (seasonally adjusted), ONS May 2022.
Union density is highest in the Black or Black British ethnic group (29.0 per cent), followed by the White ethnic group (23.3 per cent). Among those of mixed ethnic background it is 20.6 per cent and among Asian and Asian British employees it is 20.3 per cent. Density is lowest among the ‘Chinese or other ethnic group’ employees, at just 15.3 per cent.
Union density is higher among women than men in all ethnic groups. When union membership data is broken down by both ethnic group and gender, the highest union density of all is among Black/Black British women, among whom 30.3 per cent are union members.
Disabled workers
Disabled employees acknowledged under the Equality Act 2010 definition are overrepresented in union membership, accounting for 15 per cent of employees and 18.9 per cent of union members.
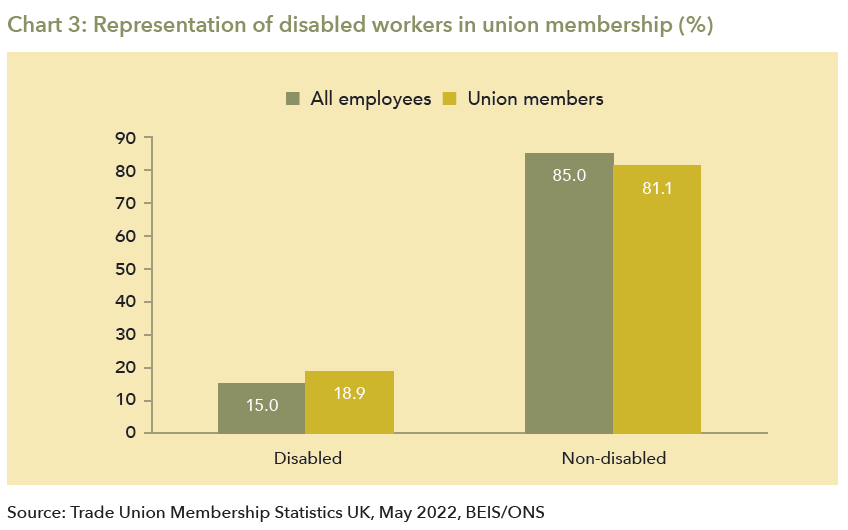

Disabled employees are also more likely to be union members, with a union density of 28 per cent compared with 22.2 per cent among non-disabled employees.
This may partly be due to the fact that they are more likely than non-disabled employees to work in the public sector, which has a higher union density than the private sector. Government data shows that in 2021 26.5 per cent of disabled employees worked in the public sector compared with 23.1 per cent of non-disabled people.3
However, disabled people are underrepresented in the workforce generally. The disability employment rate was just 52.7 per cent in 2021, compared to 81 per cent for non-disabled people.

LGBT+ workers
Unfortunately, there isn’t data on LGBT+ workers and union membership. The Government Equalities Office conducted a national LGBT survey in July 2017 that analysed responses from 108,100 individuals who “self-identified as having a minority sexual orientation or gender identity, or as intersex”.4
It found that 80 per cent of respondents aged 16–64 had had a paid job in the 12 months preceding the survey, a figure described in the report as “broadly consistent” with the general population.
However, the survey also found that trans respondents aged 16–64 were much less likely to have had a paid job in the 12 months preceding the survey than cisgender respondents (63 per cent did so compared with 83 per cent).
Young workers
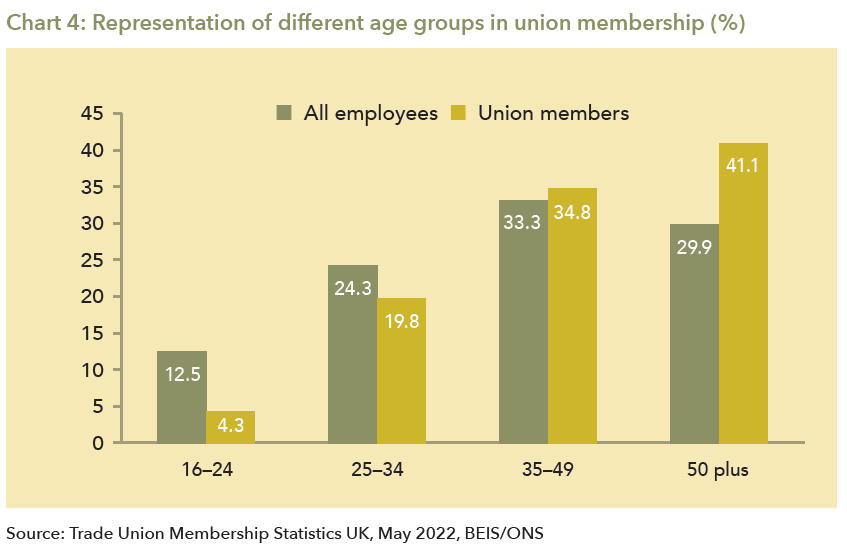
There remains a large shortfall in the representation of young employees among union members. Those under age 35 account for 36.8 per cent of employees but just 24.1 per cent of union members. In contrast, those aged 35 or over account for 63.2 per cent of employees but 75.9 per cent of union members.
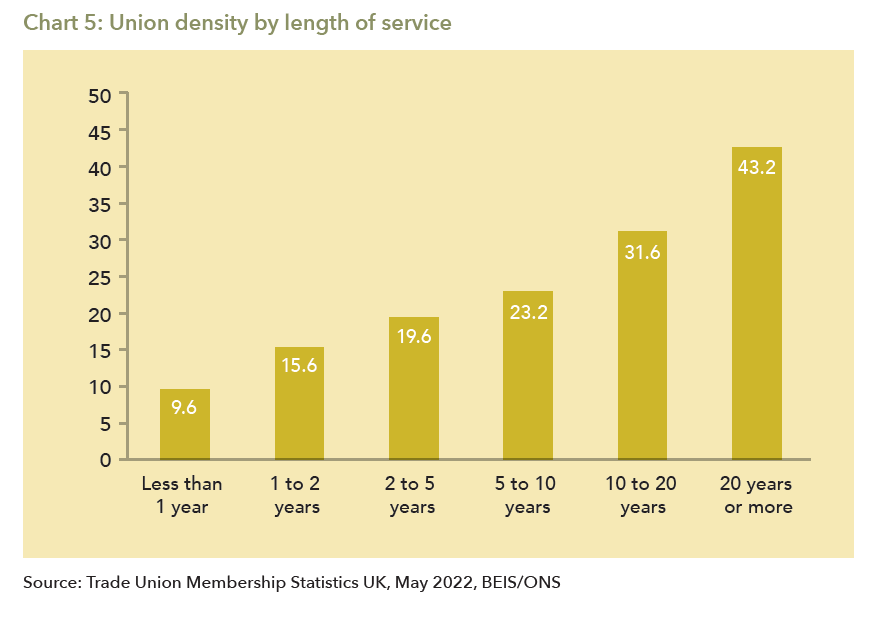
The distribution of union membership by age group also reflects the pattern of union density according to length of service with their current employer. For example, while just 15.6 per cent of those with one to two years’ service are union members, this figure doubles (31.6 per cent) for those with 10–20 years’ service.
Stay Updated
Want to hear about our latest news and blogs?
Sign up now to get it straight to your inbox